You can watch the entire 90-minute event by clicking the play button below or keep reading for the executive summary.
This client event focuses on our mid-year financial market outlook. Our intention is to keep you informed and answer any questions that you may have.
The presentation includes exploring topical themes including an inflation update along with a business cycle and financial market review, and wraps up with a discussion of some specific portfolio holdings.
In Martin’s 1992 book, the All-Season Investor, he said that inflation and volatility are “the investor’s two biggest enemies.” Joe explained why he believes these two enemies of investors will likely be with us in the years ahead.
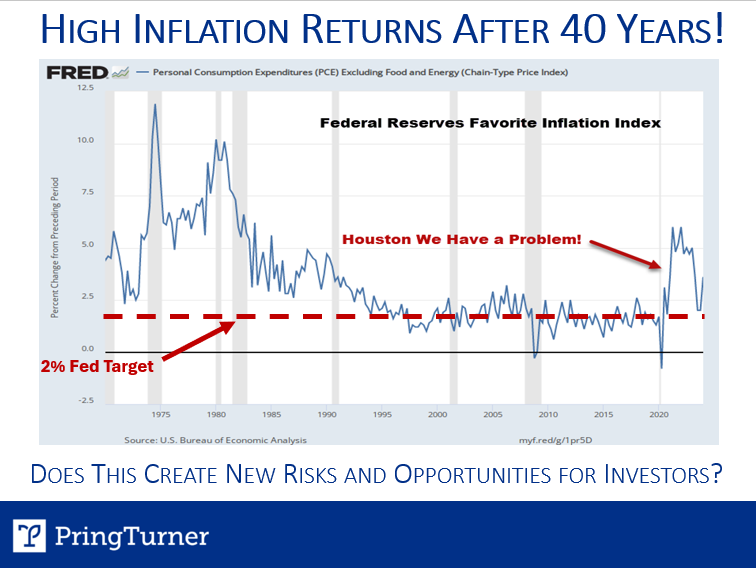
Inflation has not been a problem for investors since the in the early ‘80’s, but shortly after the pandemic we’ve had a burst of inflation again. Has the Fed let the inflation genie out of the bottle? The Federal Reserve aims to keep inflation at a 2% level, but getting inflation back down to the target has been challenging. Does this “sticky inflation” create new risks and opportunities for investors? The answer is yes!
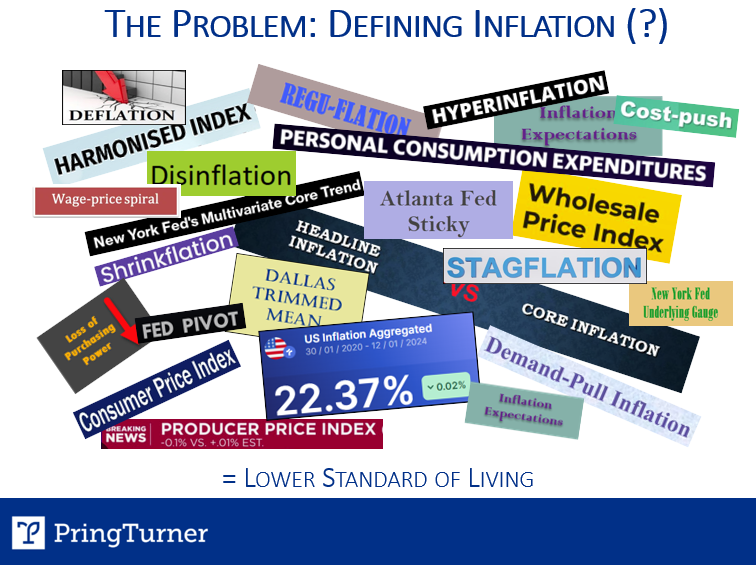
There are many challenges of defining and measuring inflation. It’s even difficult for our Federal Reserve districts, as each individual district has its own definition of inflation. Most importantly, inflation lowers our standard of living and is cumulative. Over the last four years inflation has totaled over 22%–that means our standard of living has been reduced by almost one-quarter!
Inflation is back and has an important effect on the Fed’s monetary policy. For us, as your portfolio manager, inflationary trends drive important asset allocation decisions. Investment and retirement planning must consider the cumulative effects of inflation on your standard of living.
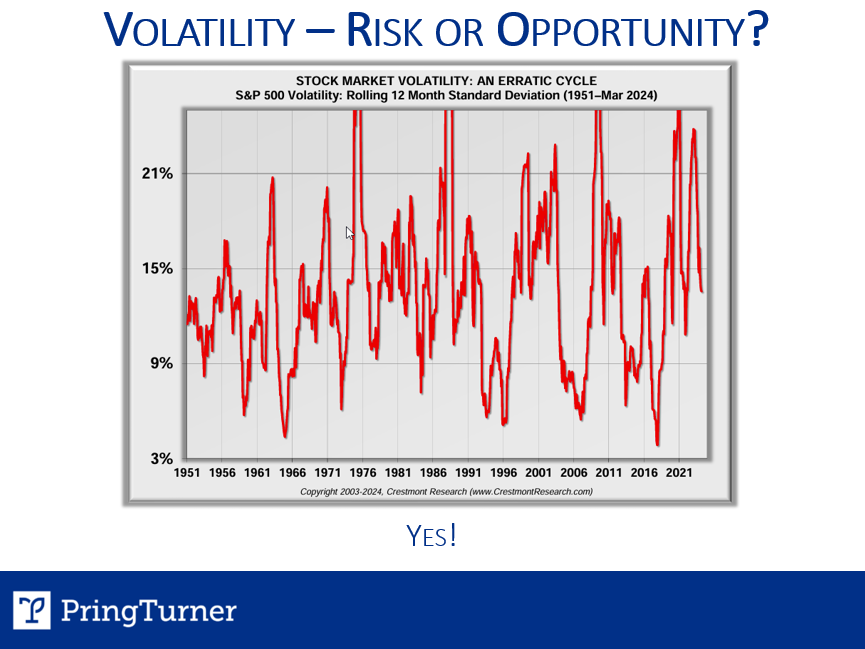
Moving on to Martin’s second threat to investors, inflation brings more volatility to financial markets. Volatility can be a risk if you are fully aware of it, or it can become an ally in an active risk management strategy like ours. We expect volatility will resurface from time to time, as it has in the past, and are prepared to pro-actively navigate portfolios through it.
There are several market structure factors that explain the likelihood of increasing price volatility. Passive investors may not fully appreciate the psychological affects of this added volatility threat. Pring Turner has an active risk management process designed to soften the effects of turbulent markets and smooth out the ride for you.
To recap, inflation is back, and reaching the Fed’s 2% target may be problematic. That equates to likely bouts of volatility to resurface in the financial markets from time to time. Today’s bout of inflation and potential added volatility requires diligence, discipline, and active investment management tactics to safely navigate the difficult periods. When you add in a dose of patience, you substantially improve the odds of beating inflation and building wealth over the long-term.
Pring Turner’s mission is to generate steady growth while taking less risk, by making timely adjustments to your investments as the economic landscape changes. Let’s review the current business cycle outlook and what that means for your portfolio.
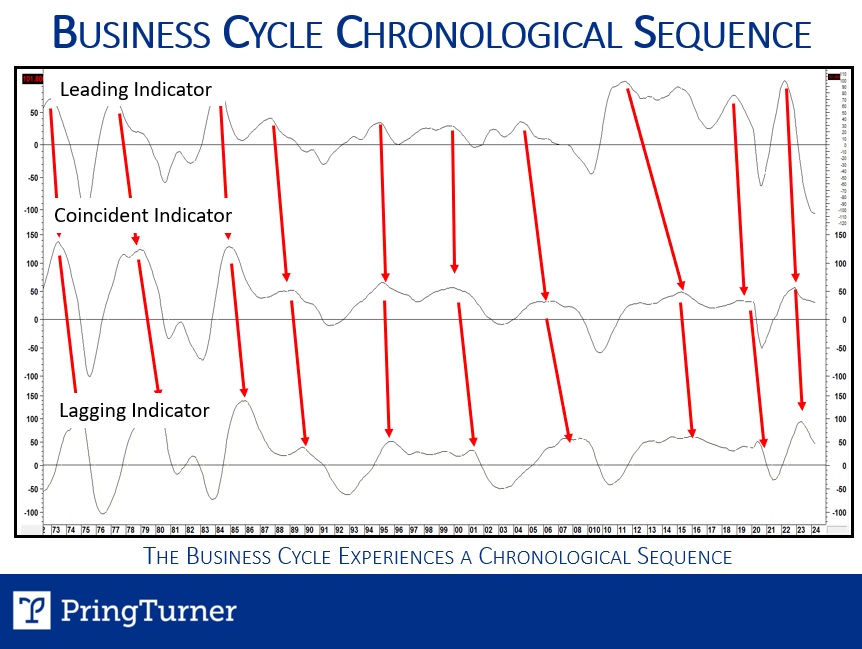
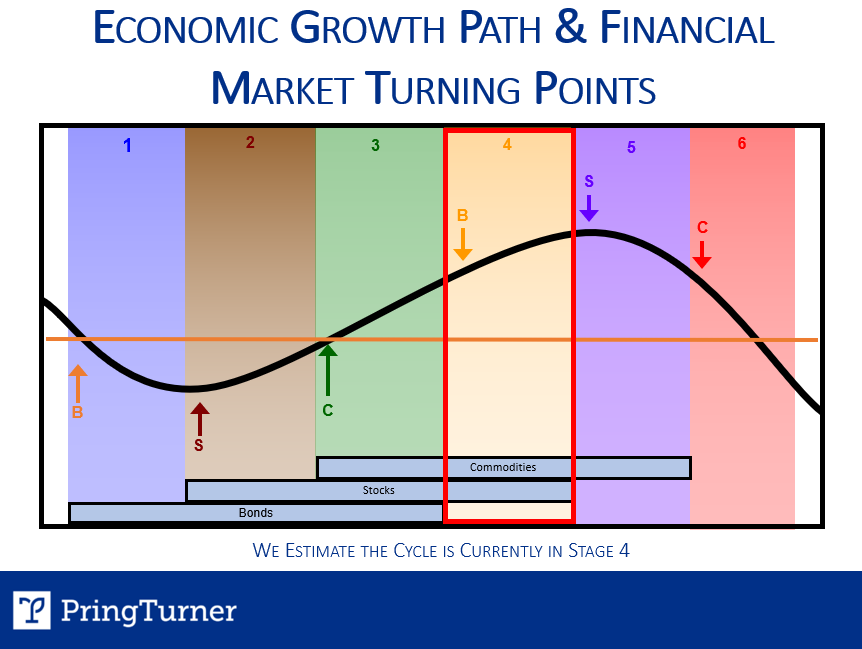
The business cycle follows a chronological sequence, first leading, then coincident and finally lagging indicators show the historical path. To better understand the relationships, imagine a train rolling along a continuous circular track with the engine (leading), carriages (coincident) and caboose (lagging) behind. The business cycle follows this repeatable pathway and by understanding the sequence we can anticipate what’s next. Now the good news for investors is that bonds, stocks and commodities follow a business cycle sequence, which is discussed next.
The six-stage model helps us dynamically adjust portfolio asset allocation around the business cycle sequence. Where are we today? The bell-shaped curve represents the ebb and flow of the business cycle. We use our proprietary barometers to help us identify which stage we are in. Today, the bond barometer is negative, and the stock and inflation barometers are positive. This puts us in stage 4, a more inflationary part of the cycle. Generally, this part of the cycle favors natural resource-based industries like precious metals and energy as well as industrial and other cyclical sectors of the economy.
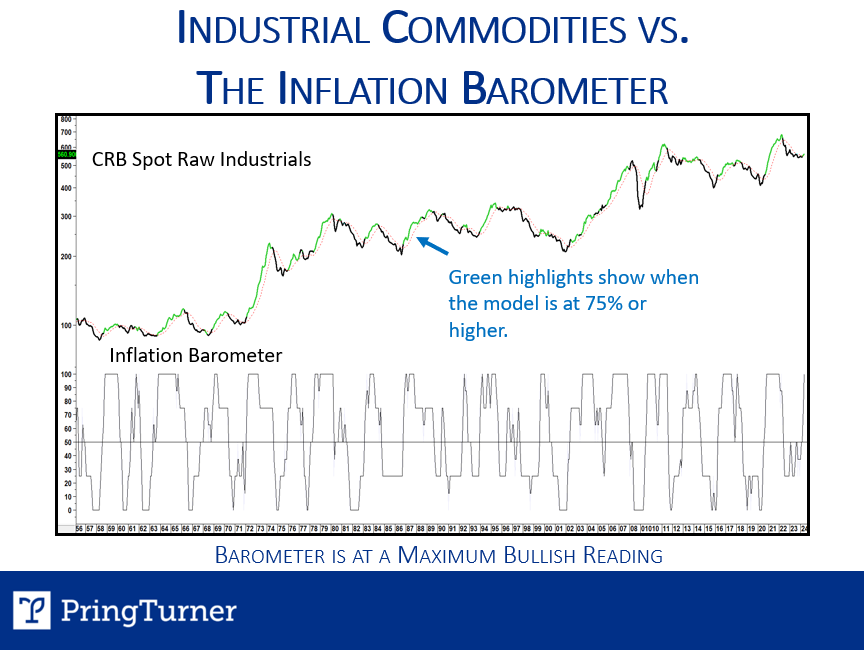
The inflation barometer defines favorable or unfavorable environments for commodities and combined with the other barometers defines the business cycle stage. Green highlights display the periods when the barometer is above 75, signaling an unusually positive environment for commodity prices. Currently, we are at the maximum 100% reading for the inflation barometer. Our stock barometer is at a maximum 100% reading as well.
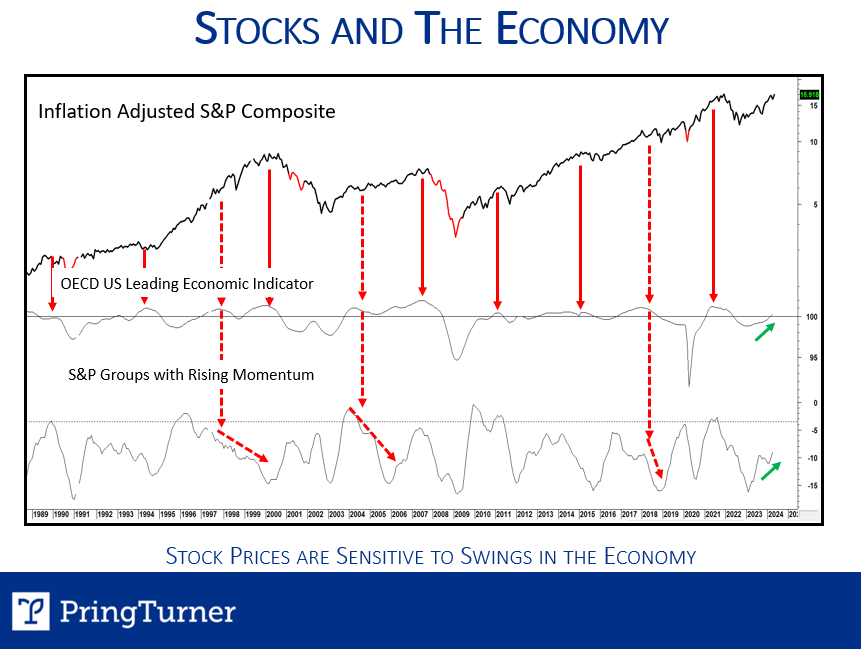
Another indicator that supports our optimistic outlook for stock prices is featured in this chart showing the momentum of the OECD US LEI (leading economic indicator). The indicator is still rising and that historically has been a favorable backdrop for stock prices. Better still, there is a growing number of S&P industry groups participating in the bull market, a favorable sign.
What does all this mean for your portfolio? Next, we will review investment themes and that can be summarized as the 4 R’s!
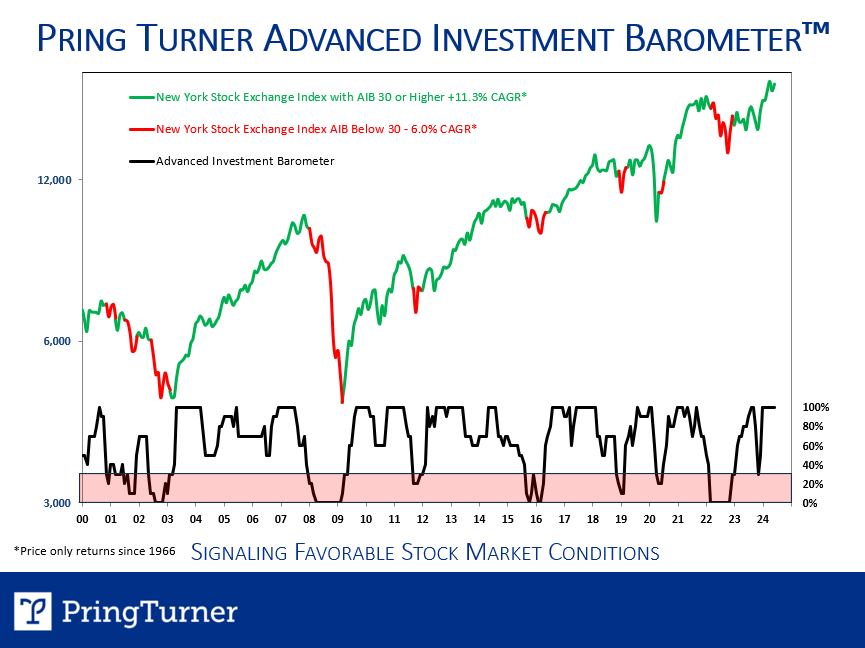
The first R is Remain Positive—As we move through the business cycle, we look to gauge risk vs reward for the stock market. Today, the Advanced Investment Barometer (AIB) is still in growth mode, a favorable environment for stocks. Should storm clouds appear on the horizon you can be sure we will take gradual steps to protect your portfolio.
The good news is that about three-quarters of the time we are in “growth” territory, and in “protect mode” only one-quarter of the time .
The last time we were in protect mode was 2022, and you might remember we took steps to reduce stock exposure and dial down the volatility in your portfolio. It’s been a bull market since October of 2022, and as long as our AIB stays positive we will remain optimistic for stock prices.
Our AIB is constructed from a number of trend, momentum and inter-asset relationships. The primary function of the barometer is to warn about major bear markets. Although not perfect, the AIB has a credible long-term track record (since 1966). When above 30, the NYSI averaged 11.3% growth (price only, not including dividends). On the other hand, when in the danger zone below 30 the returns are -6%. The current 100% maximum positive reading is a good reason to remain positive.
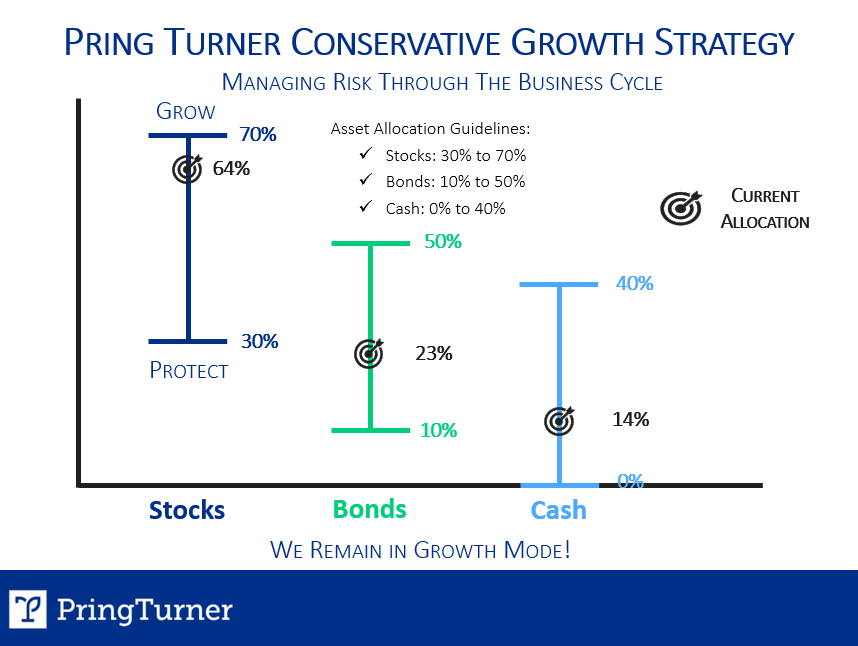
Here’s how we adapt conservatively managed portfolio allocations to changing business cycle conditions.
The dark blue line on the left represents the range of stock exposure in portfolios–from the lower range (protect mode) in the 30’s to the higher range (growth mode) in the 60-70% level.
The green line represents the bond allocation, from 10-50%. Bonds tend to do well during business cycle slowdowns while stocks do not. So, as the stock allocation goes down, the bond allocation will go up. This active process is a key risk management tactic to protect your portfolio from severe drawdowns.
Lastly, the light blue line represents the cash or cash equivalent balance in portfolios and ranges from near zero to 40% while in protect mode.
Where are we today? On average for our conservative growth strategy, stocks 64%, bonds 23% and cash equivalent 14%.
Next, we can talk specifics within portfolios and go over some inflation beneficiaries, our second R—Royalties.
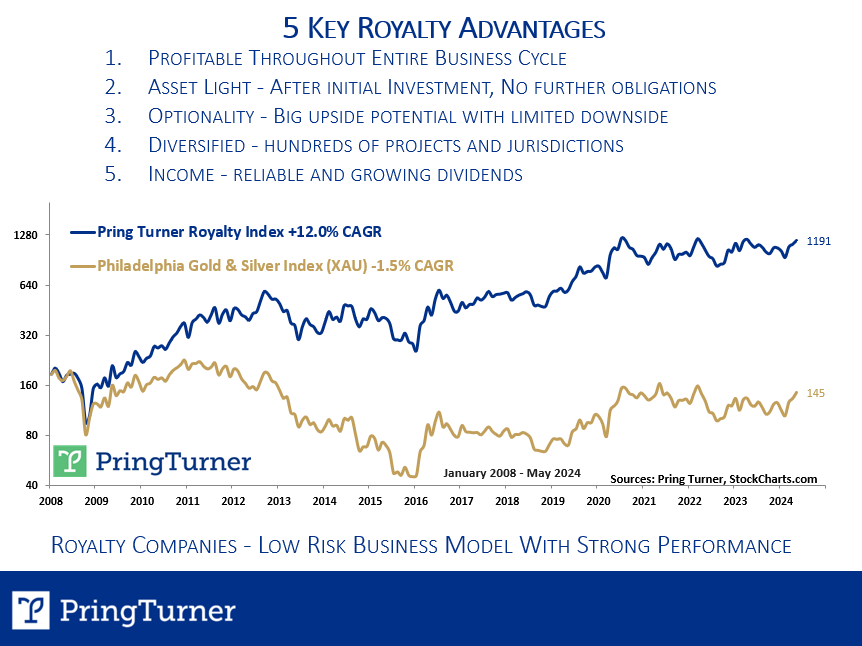
As highlighted earlier there is a significant impact of inflation on investments during the current business cycle. We expect royalty investments would perform well in an inflationary environment. The focus was on precious metals royalty companies, like gold, silver, and copper. These companies provide upfront investments to mining operators, who in turn promise a share of future revenue. This arrangement benefits both the mining operators and the royalty companies.
Profitability Throughout Business Cycles: Unlike mining companies that may lose money during certain stages of the business cycle, royalty companies remain profitable due to their investment structure, even if earnings fluctuate.
Asset-Light Model: After the initial investment, royalty companies are not responsible for operations and management. This shields them from rising costs of equipment and labor, potentially benefiting from increased prices of mined products.
Optionality: Royalty companies benefit from the potential of mines producing more than projected, offering significant upside without substantial risk.
Diversification: With investments in hundreds of projects across various jurisdictions, royalty companies reduce risk compared to owning a few mines in limited areas.
Income: Royalty companies have substantial excess capital, which can be used for dividends or share repurchases, providing reliable and growing returns to investors.
The chart at the bottom shows that over a long time horizon, mining companies have struggled to perform well, particularly in a low inflation environment with stagnant gold prices. Conversely, royalty companies that invested in these mining operations have achieved strong annual returns. This shows the power of royalty companies lower-risk business model. We believe they are suitable investments for all business cycle stages but tend to perform exceptionally well during inflationary periods.
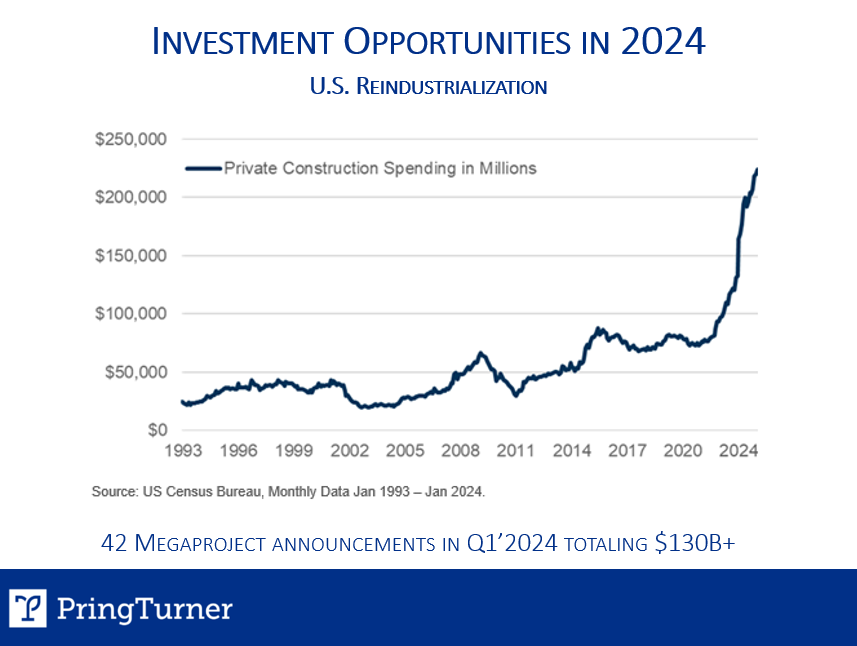
The third R stands for “Reindustrialization”– the revival of the manufacturing sector is in full growth mode. In the first quarter of 2024 a total of 42 “Megaprojects” of $1billion or more was announced. That totaled over $130 billion in private construction spending on these massive projects!
Our view is this will be a decade long theme with plenty more opportunity.
The Covid pandemic exposed a major national security issue– reshoring to bring manufacturing back from overseas will reduce dependency on foreign supply chains. Politicians on both sides of the aisle agreed, and government policies were put in place to incentivize the reindustrialization process. This included tax breaks for new manufacturing plants and major infrastructure investments. The new facilities will feature the latest in technologically advanced automation, robotics and AI, making them amongst the most productive in the world.
One potential negative for the reindustrialization theme—making products here vs overseas will be more expensive and add another tailwind to the inflation problem.
Beyond all the artificial intelligence (AI) hype and over-emphasis on one company (Nvidia), there are many other lower-risk opportunities as companies adopt AI. Many of your portfolio holdings are adopting the latest technologies to become more productive and profitable.
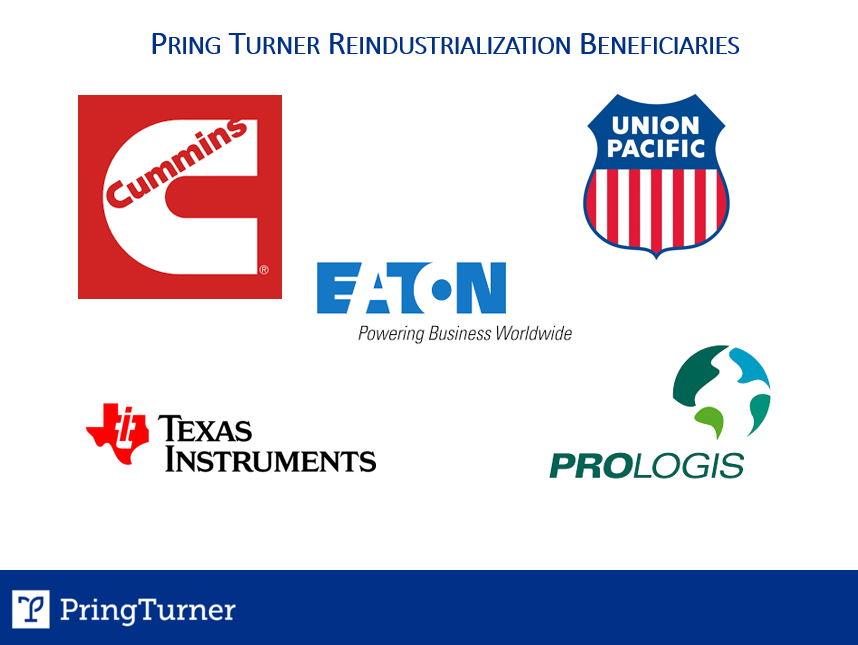
These are some examples of reindustrialization beneficiaries:
Eaton—supplies electrical and power management products that serve commercial and industrial projects, aerospace and vehicle segments, utilities and data centers.
Cummins—maker of diesel engines, and pioneering work in natural gas, electric, hybrid, and fuel cell technology. Their vehicle powertrains serve a wide array of manufacturers and utilities.
Texas Instruments—is more than just handheld calculators, their chips support the “internet of things” as world digitizes.
Union Pacific—the most efficient transporter of goods, materials and finished products across the western half of US.
Prologis—an industrial warehouse REIT. Approximately 3% of global GDP flow through their warehouses with major tenants being Amazon, Home Depot and FedEx. Their state-of-the-art warehouses are highly automated, utilizing robotics, AI, and solar.
A real estate investment trust (REIT) is an investment that owns and operates income-producing real estate on a large scale. We believe there are significant benefits to investing in publicly traded REITs compared to owning real estate privately.
Liquidity: Publicly traded REITs offer the advantage of liquidity, allowing investors to buy or sell easily on the stock exchange, unlike privately owned real estate which can take time to transact.
Less Leverage: Public REITs typically have significantly less leverage compared to private real estate investments, reducing the risk of financial distress and potential losses during market downturns.
Lower Borrowing Costs: Public REITs can access capital markets more easily and secure lower borrowing costs compared to individual investors, making their debt financing more affordable and attractive.
Locations: Public REITs often own hundreds or even thousands of investment properties across various locations, providing investors with diversification and reducing the risk associated with owning a single property.
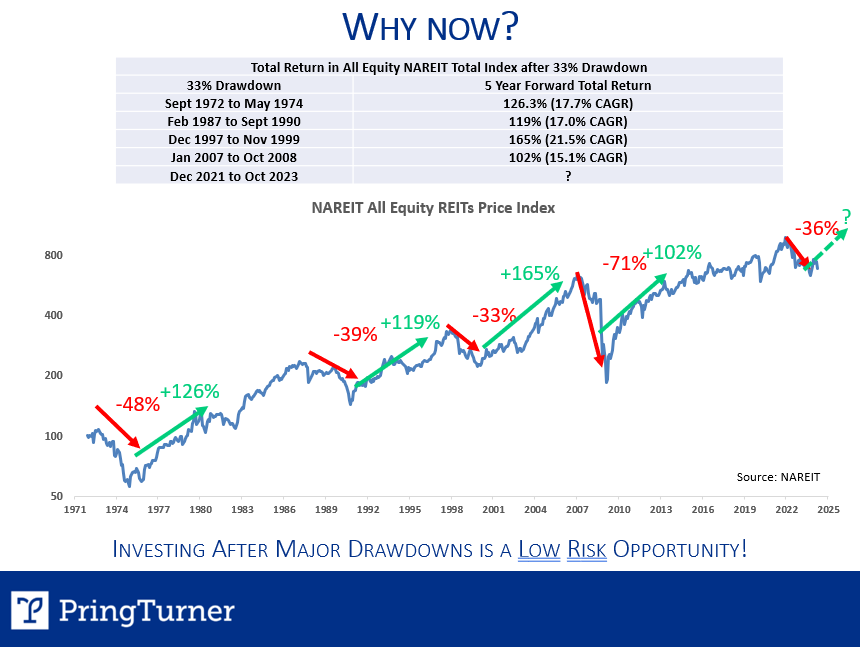
We reviewed data from the 1970s and found that after every instance of a 33% or greater drawdown on the NAREIT All Equity REIT Index, the subsequent five-year returns have consistently been strong. Historically, investing in REITs following significant drawdowns has proven to be a low-risk opportunity, and we believe this trend will continue in the current environment.
Equity Lifestyle Properties (ELS) operates premier manufactured home and recreational vehicle resorts, with a particular focus on the retirement market. With an impressive track record spanning five decades, ELS has successfully curated a diverse portfolio encompassing more than 450 properties and resorts across 35 states and British Columbia.
Mid-America Apartment Communities Inc. (MAA) is focused on ownership, development, and operation of approximately 100,000 apartment units. MAA’s properties are located in key Sunbelt markets such as Dallas, Tampa, Orlando, Charlotte, Austin, the Carolinas, Charleston, and Houston.
Public Storage (PSA) specializes in the ownership, development, and operation of self-storage facilities. With a strategic presence in 40 states, PSA owns and manages almost 2,900 self-storage facilities.
Prologis (PLD) owns and operates industrial distribution centers strategically positioned near major metropolitan areas, in proximity to critical infrastructures like highways, ports, and airports. Major tenants include Home Depot, Amazon, FedEx, PepsiCo, and UPS.
To summarize, our indicators continue to show positive signals. Although we remain attentive to potential risks, our proprietary metrics suggest that the outlook remains favorable. As a result, we are sustaining a positive stance and implementing an offensive strategy, focusing on inflationary investment opportunities pertinent to the current business cycle, including royalties, reindustrialization, and real estate.
Katie emphasized the importance of signing up to securely send and receive documents, which is safer than using email or postal mail. Joe addressed inflation and volatility, assuring that we are prepared and vigilant. Martin discussed our position in stage four of the business cycle and relevant opportunities. Lastly, Tom and Jim highlighted how our active strategy is well-positioned to capitalize on inflationary investment opportunities.
Investment decisions formulated by Pring Turner Capital Group, Inc. are based on proprietary research and methods developed since 1977 by the owner/managers of the firm. None of the material contained herein is intended as a solicitation to purchase or sell a specific investment. Readers should not assume that all recommendations will be profitable or that future performance will equal that referred to in this material.

