You can watch the entire 70-minute event by clicking the play button below or keep reading for the executive summary.
Since our founding in 1977, we have successfully helped our clients navigate through many bull and bear markets – this includes periods of inflation, deflation, wars, banking crises, recessions, and even a global pandemic. The past year and a half has been no different. There were plenty of adverse headlines to worry investors. Early last year, an abrupt start of the Russia/Ukraine war sparked sharply higher oil prices and added fuel to an already troublesome inflationary spiral. To bring inflation back down, the Federal Reserve raised interest rates at the fastest pace in memory. Moving interest rates from near zero to 5% within a year added stress to the banking system, and with it a few bank failures surfaced this March. However, this is nothing new to us. We have managed through plenty of volatile boom-and-bust eras. In fact, periods of volatility like this are the reason Pring Turner built a conservative investment strategy with many layers of built in protection for your portfolio.
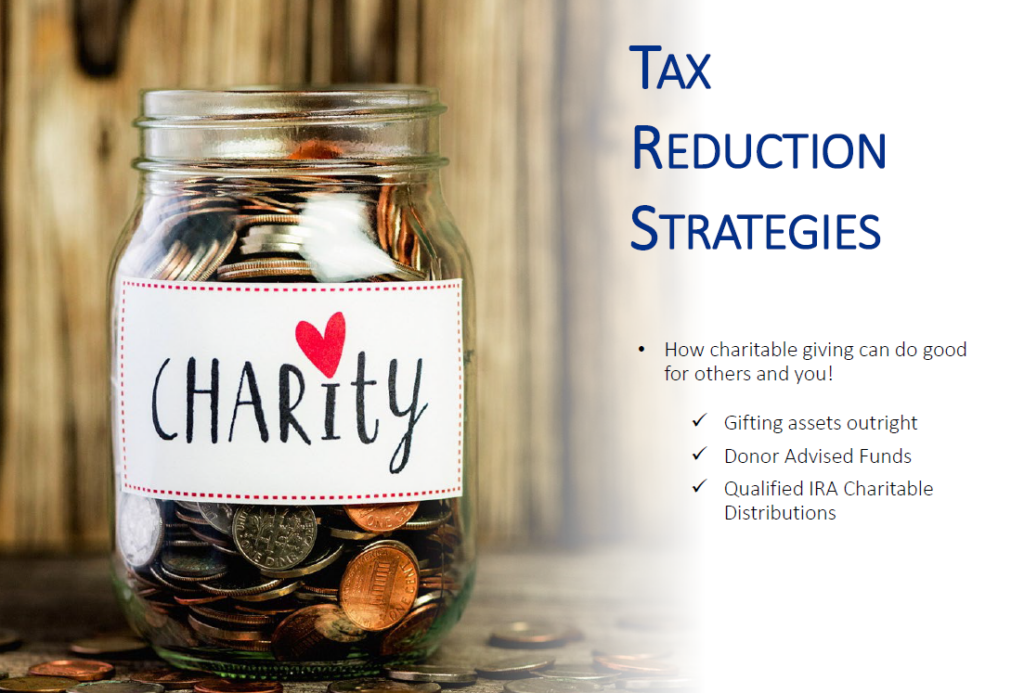
To kick things off, Pamela responded to a common question clients ask us: “What can I do to lower my taxes?” While there are dozens of tax savvy strategies out there, we highlighted three ways that charitable giving could be a possible approach.
For those who itemize their deductions, gifting assets outright (especially highly appreciated stock) has the potential to both increase your deductions and eliminate the capital gains tax.Next, we mentioned how you could open a Donor Advised Fund with Schwab Charitable, a 501(c)3 organization, to provide you more flexibility with your charitable choices. Donor Advised Funds could allow you to receive an immediate tax deduction worth the fair market value of your donated assets, while those assets grow tax-free until you are ready to gift to qualified charities.
Lastly, for those who are 70½ or older, we discussed how Qualified Charitable Distributions (QCDs) could be a useful tool. QCDs are a way to gift up to $100,000 per year to qualified charities directly from your retirement account, rather than you taking a taxable Required Minimum Distribution.
You are always welcome to contact Pamela, our team’s Certified Financial Planner™, if you are interested in reviewing your unique circumstances and learning about tax savvy strategies that may work for you.
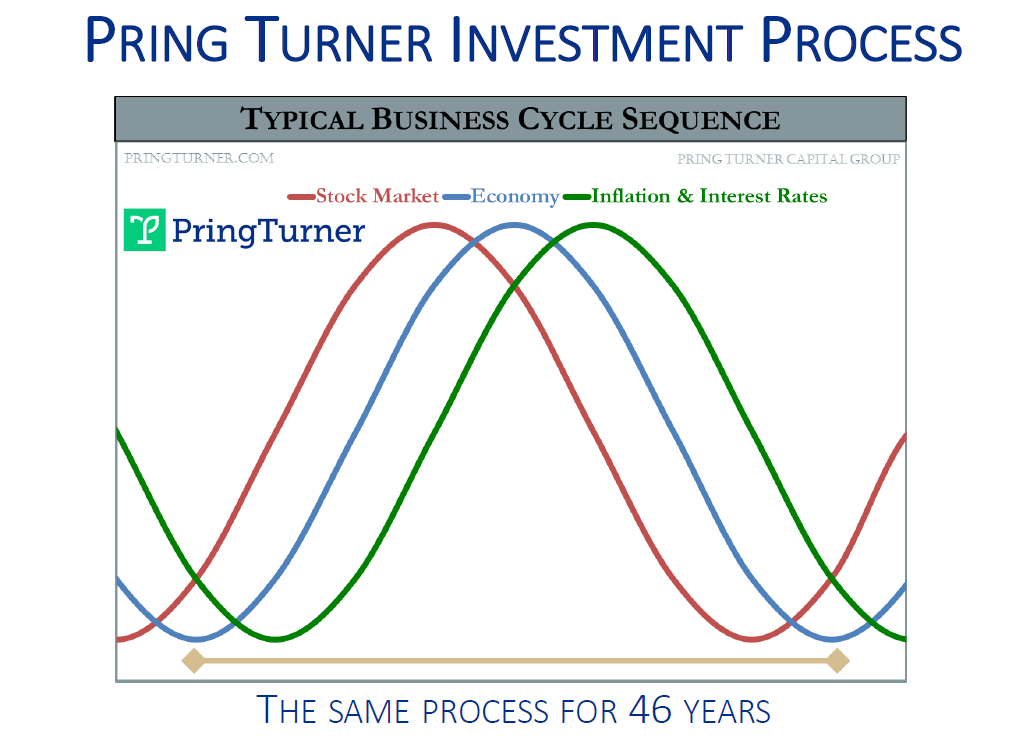
For over 46 years, Pring Turner has utilized the same disciplined investment process that aims to protect and grow your valuable assets. Pring Turner’s process is unique as we utilize proper business cycle forecasting tools and disciplines. The last 160 years of economic and financial history show that markets are linked in a logical way to business activity. Understanding the historical, reliable, and sequential relationship of the business cycle to stocks, bonds, and inflation-sensitive assets makes it possible to create better returns with less risk – as well, for you to achieve greater peace of mind.
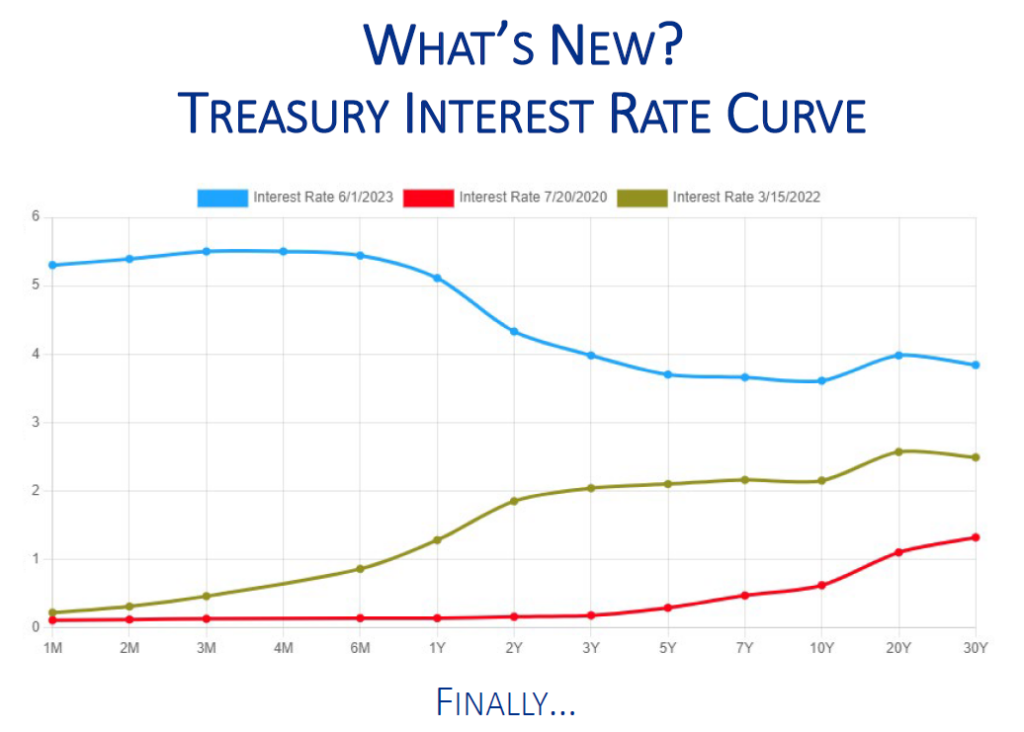
The sharp increase in U.S. Treasury interest rates finally present us an opportunity to both increase income in your portfolio and see potential capital gains. Compare the nearly 0% interest rates in mid-2020 (red line) to where they were in March of 2022 (green line), when the Federal Reserve began their steep rate tightening cycle. The blue line represents where interest rates are currently. In three years, we went from a nearly 0% to more than 5% return for Treasuries with less than a 1-year maturity. Longer-term rates are in the 4% range. This presents the first real opportunity, over many years, to lock in high quality income returns in the fixed income markets.
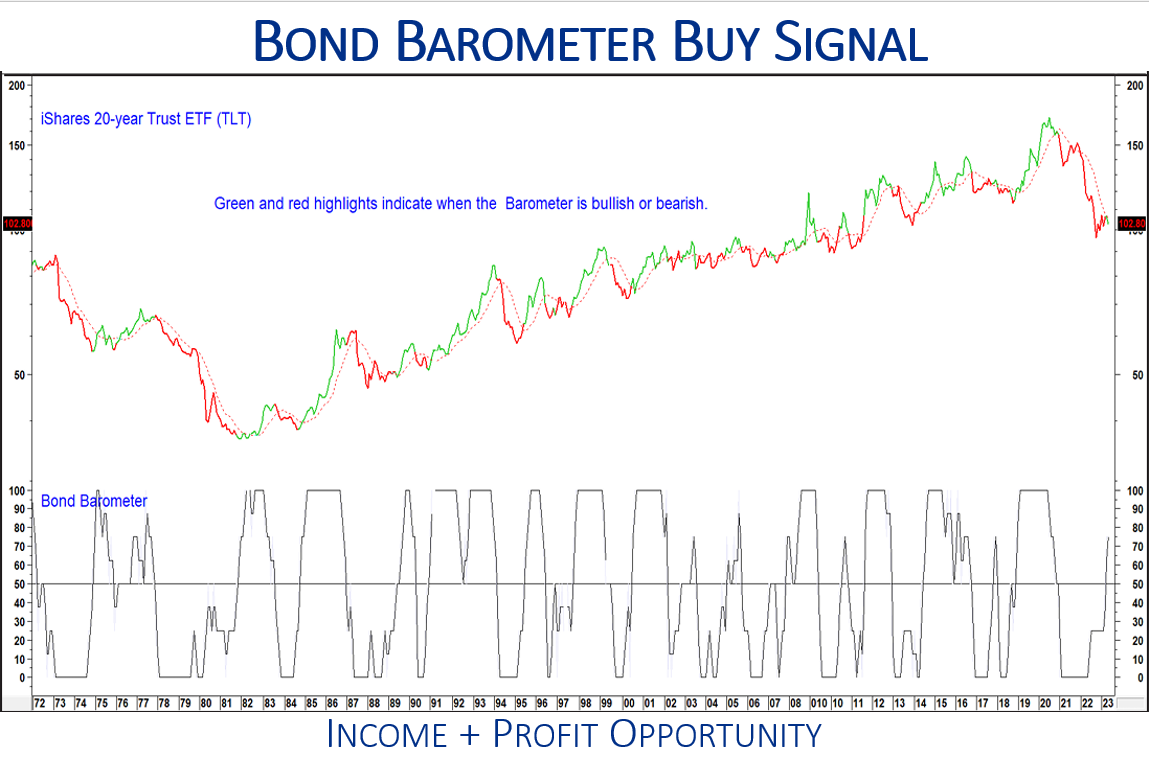
The Pring Turner Bond Barometer defines favorable or unfavorable environments for bonds and, combined with our other barometers, defines the current business cycle stage. The Bond Barometer recently went positive (above 50) signaling a lower-risk time to add fixed income into your portfolio. The upper line shows the price of a longer-term U.S. Treasury ETF (TLT). It is shaded red when the bond barometer is below 50 and green when above. The recent positive shift in the Bond Barometer explains why we may have been adding longer-term Treasuries to your bond ladder. In essence, for the first time in years, we see income and capital gain opportunity in Treasury securities.
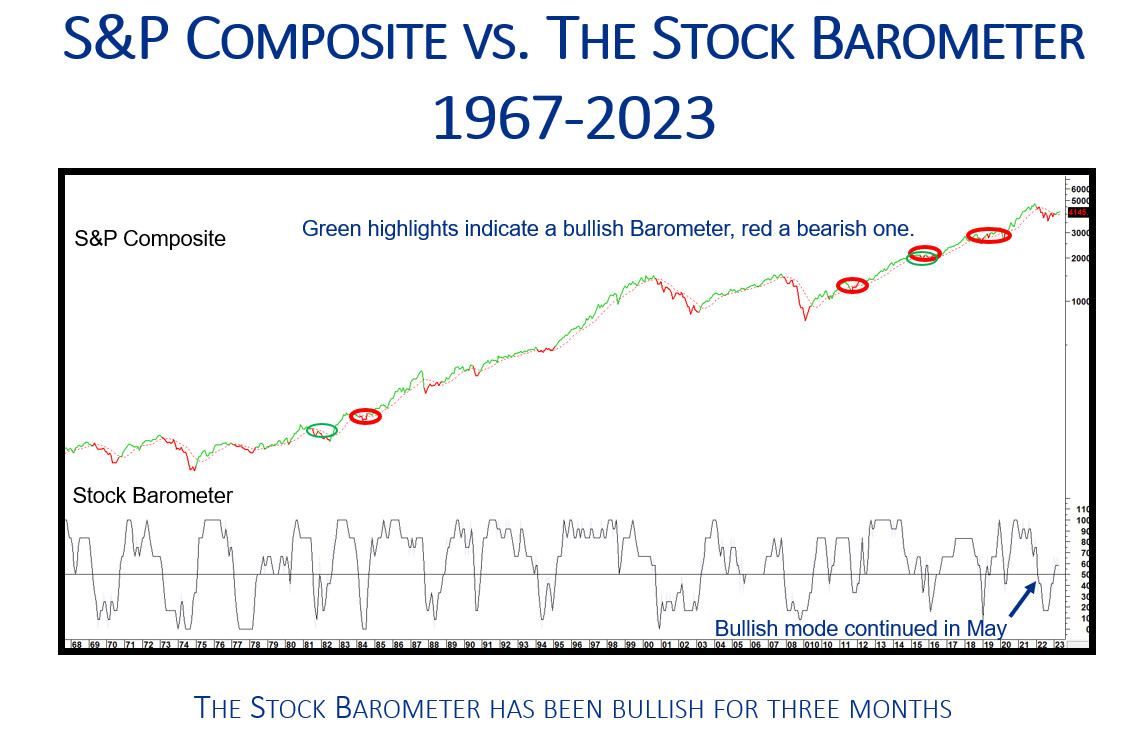
Turning to the other major asset class, we looked at our Stock Barometer, which is composed of six different components. Again, readings above 50 are positive (green highlights) and below 50 are negative (red highlights). The barometer has done a good job of keeping us invested during favorable periods. More importantly, it has helped us be more conservatively invested during the occasional devastating bear markets. The recent positive signal suggests a more favorable environment for the stock market. Although not perfect, the stock barometer has a very credible long-term record.
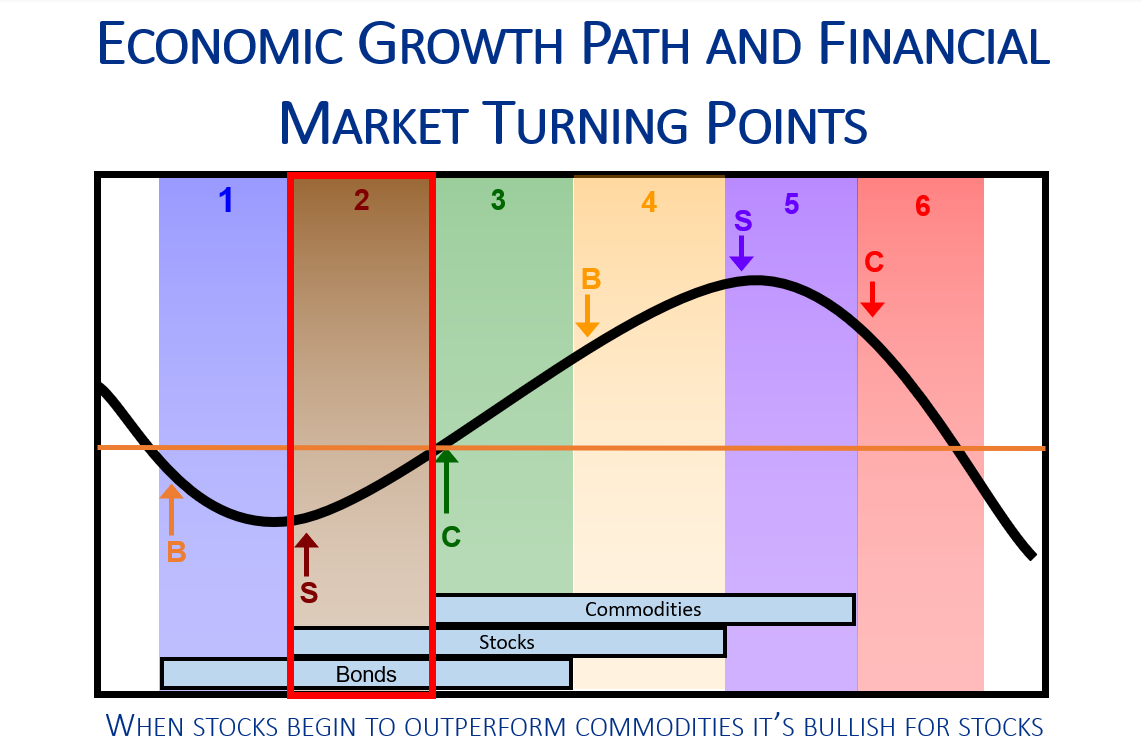
Putting the positive Bond and Stock Barometer readings together, tells us we are now in Stage 2 of our six-stage business cycle sequence. Our Inflation Barometer is the only one with a negative reading right now, suggesting the natural resource sectors of the market may lag others for the time being. The key point to make is that when stocks begin to outperform inflation-sensitive assets (commodities) it is bullish for stock prices. Our next slide demonstrates the historical relationship between stocks and bonds.
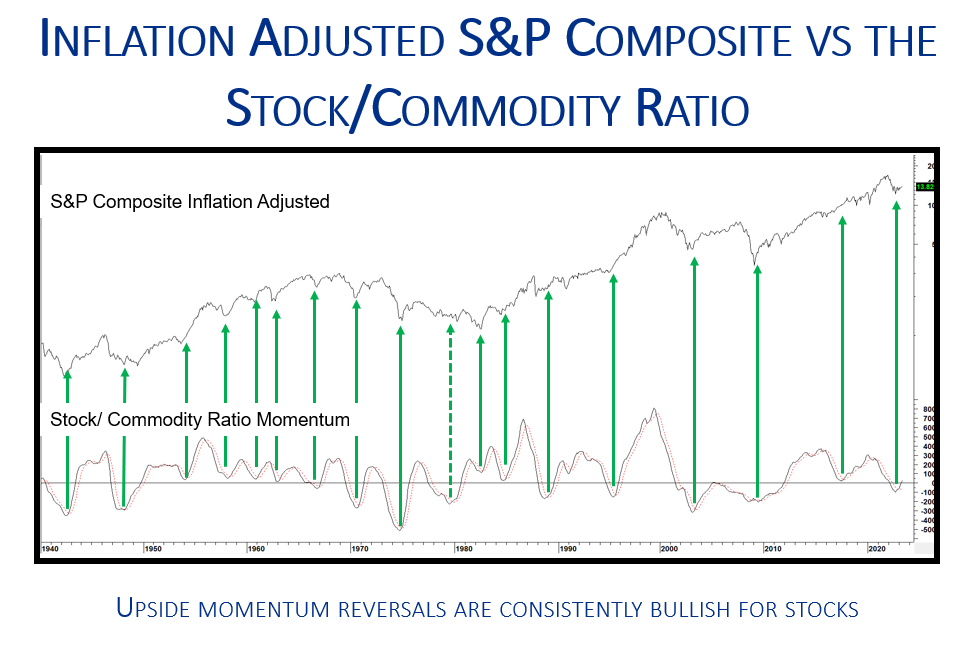
In our September 2022 webinar, we highlighted this chart as one to keep an eye on, in order to become more positive for stock prices. The upper line is the S&P 500 (adjusted for inflation) with data going back to the 1940. Below is a momentum indicator of the ratio between stocks and commodities. The green arrows point out the times when the indicator begins to turn up and stocks start to outperform commodities. Except for one false signal in the early 1980’s, the indicator captured important stock market turning points and wealth-building opportunities.
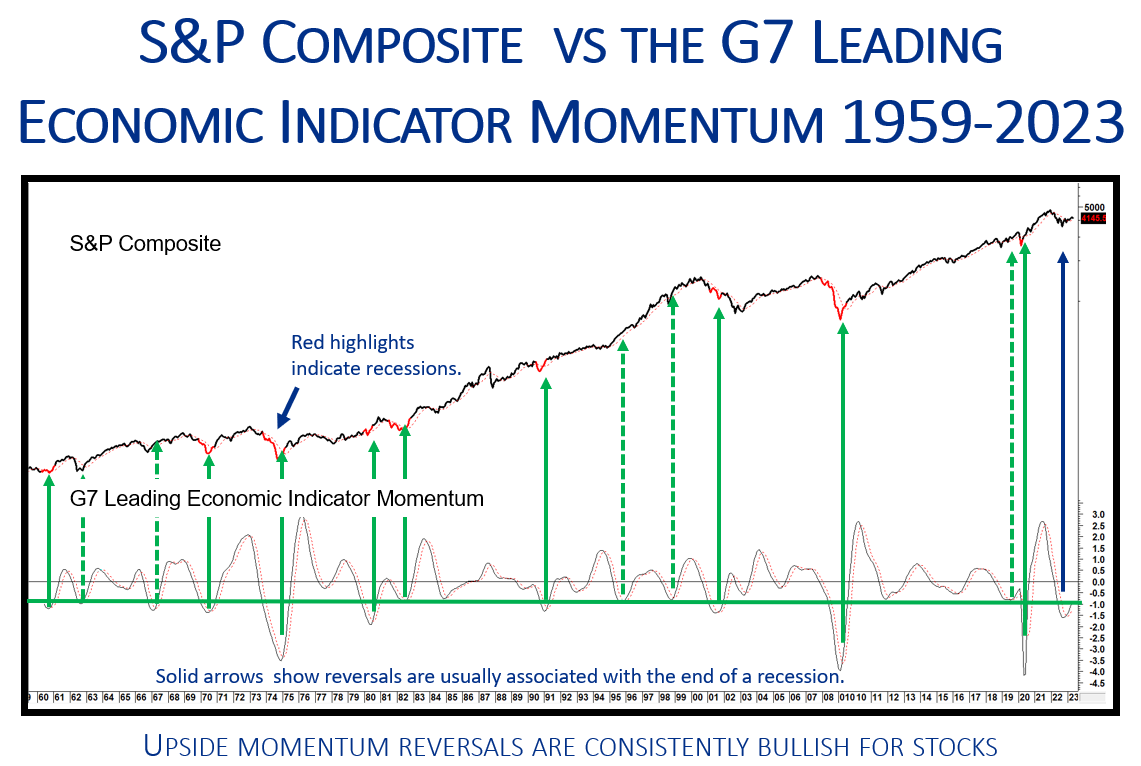
Another positive sign for the markets is this message from the G-7 Leading Economic Indicator (LEI). The G-7 is comprised of the seven largest developed economies in the world, and it is useful to gauge whether economic momentum is trending higher or lower in these heavyweight countries. The upper line is the S&P 500 and the lower panel displays a momentum indicator for the G-7 LEI. The green arrows point out the times when economic momentum across the G-7 turns up a recession (red highlights) or mid-cycle slowdown (dashed green arrows) is near ending. Since turning up about 4 months ago, this indicator continues to improve, adding support for a continued stock market uptrend.
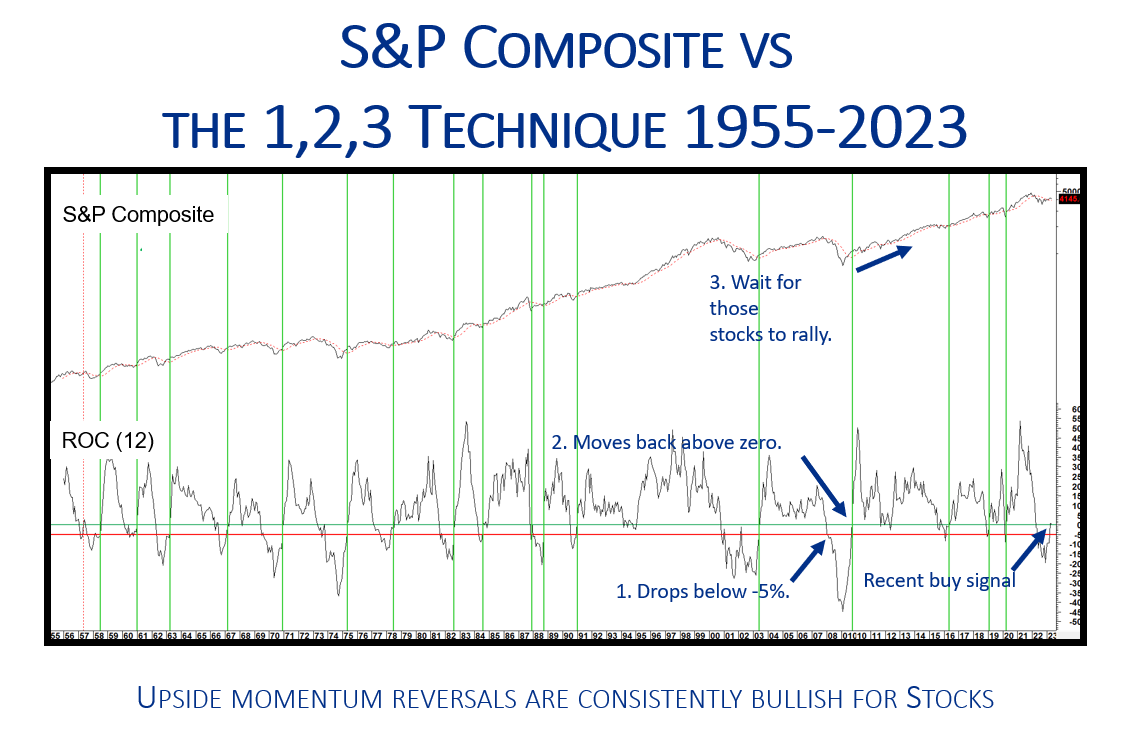
Lastly, we highlighted one technical market indicator that has a good track record of signaling favorable stock market periods. This three-step process starts with: (1) the 12-month Rate of Change (ROC) for stock prices dropping by 5%, as seen in the lower panel when the ROC line drops below the red line. Next, (2) wait for the ROC to move back above zero (green horizontal line). Then (3), wait for stocks to rally (green vertical lines)! This is the thirty-ninth buy signal since 1900! Previous positive readings have led to strong stock market returns in the following twelve months, on average about 14% versus about 7% over all periods. It is important to note that not every signal was successful, although these upside reversals have been consistently bullish for stock prices.
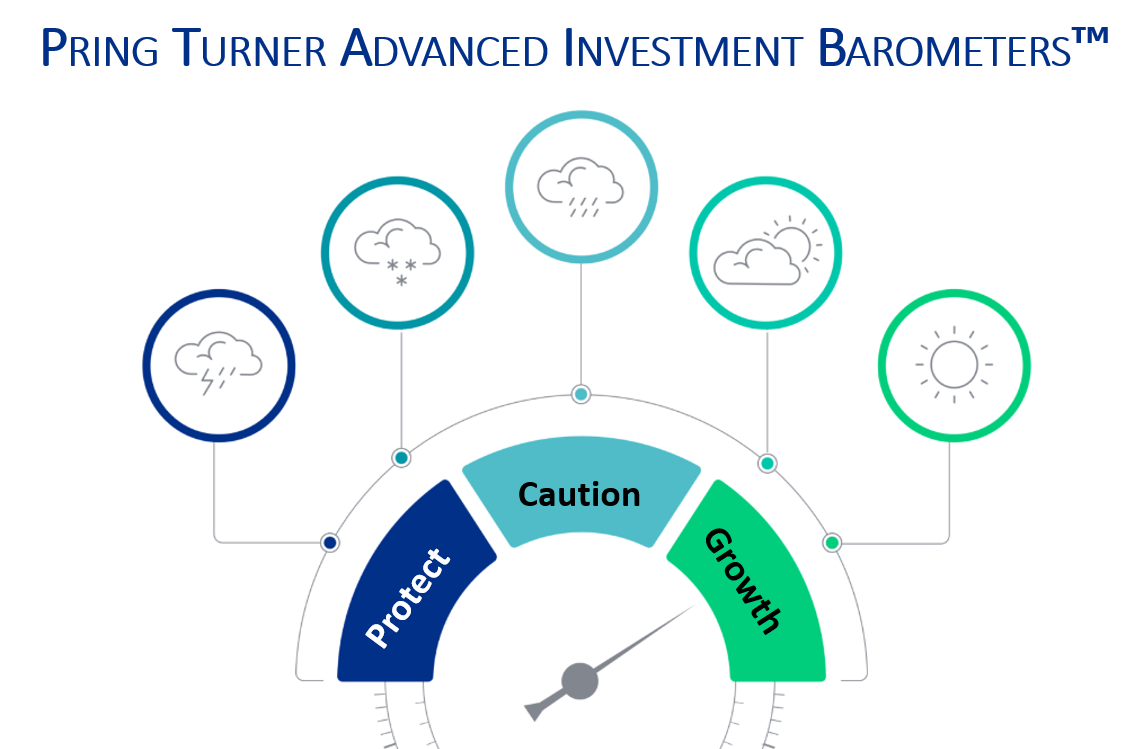
Our January client newsletter suggested that 2023 would likely be a transition year where our portfolio tactics could move from defense to offense. Looking back, it has been a busy 18 months where our Advanced Investment Barometers (AIB) moved from Growth to Caution to Protect, and now have reversed again back to Growth mode. Indeed, 2022 was one of the most challenging years ever for stocks and bonds combined. Difficult years like that demonstrate the value of a pro-active investment process that systematically takes steps to protect your portfolio during financial storms. As 2023 began, our AIB gradually improved to Growth, making it the right time to start putting the offense back on the field. Simply put: Our investment process adapts to economic and financial market changes – and, as the world changes, we make changes to your portfolio.
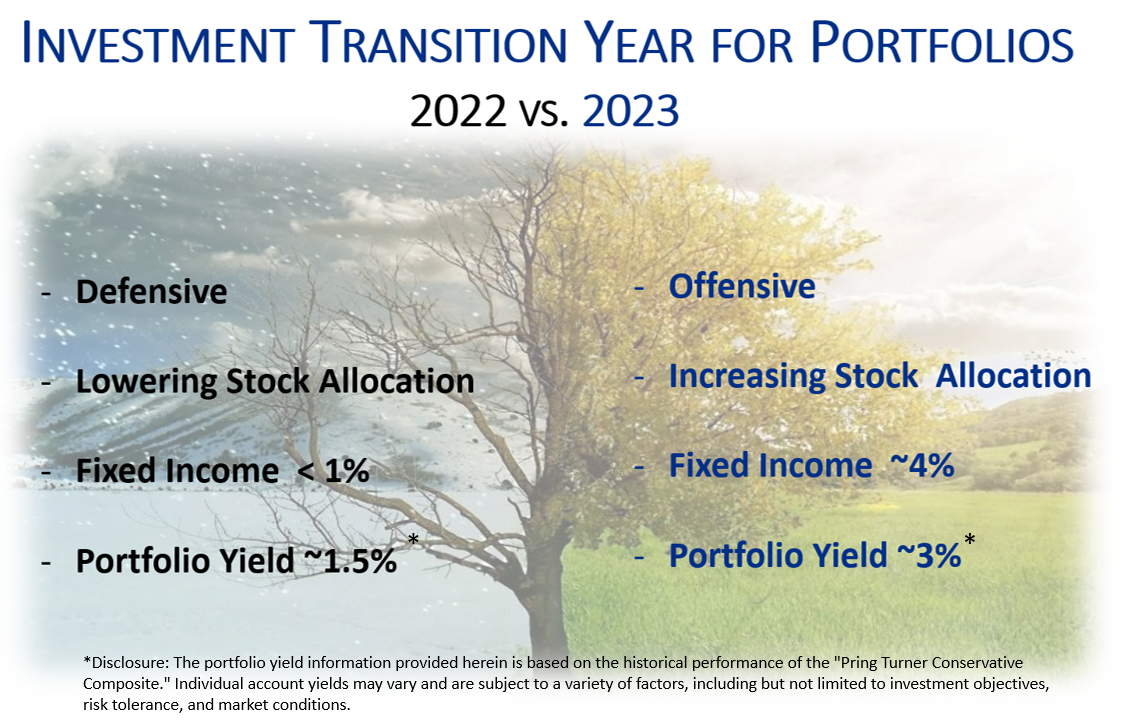
In 1992, Martin published a popular book titled “The All-Season Investor”. He explained how financial markets move through their own seasons– this is the 6-stage business cycle process. The calendar year has four seasons, and the financial markets have six. Our metaphor in the graphic above displays how we are moving from Winter (protect) to Spring (growth) in your portfolio. The defensive tactics that were utilized in 2022 included reducing your stock market exposure by taking some profits. Portfolio yields were low to start last year, but as rates spiked higher, we added to your U.S. Treasury ladder to boost income and add stability. Today, Spring has arrived, which means it is time to plant the seeds for the next wealth-building period. With bond and money market fund yields substantially higher than a year ago, the portfolio yield for the Pring Turner Conservative Composite roughly doubled to approximately 3%*. Solid income is great to see month in and month out. Even if the market moves sideways, dividend and interest income keep rolling in while we patiently wait for growth to eventually kick in.
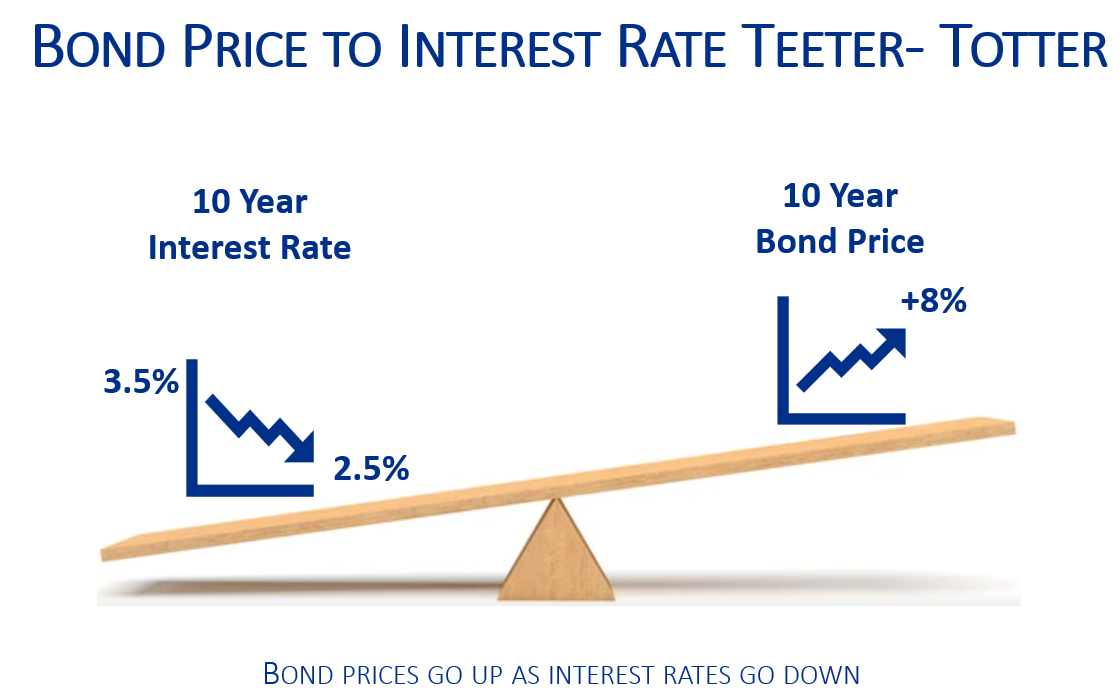
Next, we would like to discuss a couple of topics related to investments and portfolio management. We begin by using the analogy of a teeter-totter to explain the relationship between interest rates and bond prices. When interest rates decrease, the value of bonds will increase. In our example, if interest rates decline by just 1% on a 10-year Treasury bond the value of the bond will increase by about 8%. The combination of 3.5% income and 8% capital appreciation adds up to an 11.5% total return. It is important to note that the longer the maturity of a bond, the more its value will be affected by interest rate moves. The level of interest rates not only affects the value of bonds but also the value of other investment assets like stocks and real estate.
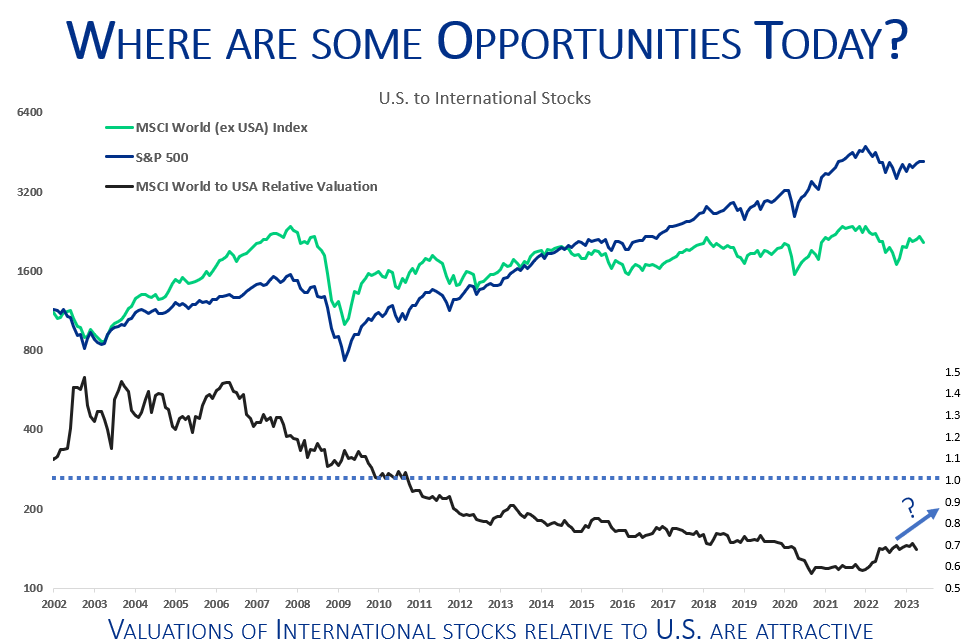
As far as stock market opportunities and recent portfolio additions, we are intrigued by the value being offered by international stocks. This chart compares the relative performance of U.S. (blue line) versus international stocks (green line) over the past couple of decades. Since 2009, US stocks had generally outperformed international stocks, creating a substantial decline in the relative valuation of international stocks relative to US stocks (lower black line). This indicates that international stocks are presenting an attractive investment opportunity, and that is one reason we have begun adding exposure to this asset class. International stocks also provide more diversification to investment portfolios which is an added bonus.

The Pring Turner approach to building portfolios includes many, many layers of protection. Joe has often described this process as “layers of the onion”, where the combination of business cycle analysis, active allocation, high-quality investments, and dependable income are just some of the layers of protection. The aim is to create a portfolio that balances risk and return, while providing you with peace of mind, especially during the occasional bear market. Since our founding in 1977, this prudent approach has helped generations of clients safeguard and build their wealth.
*The portfolio yield information provided herein is based on the historical performance of the “Pring Turner Conservative Composite.” However, it is important to note that individual account yields may vary and are subject to a variety of factors, including but not limited to investment objectives, risk tolerance, and market conditions.
DISCLOSURES
The views expressed herein represent opinions and, are provided for informational purposes only and are not intended as investment advice or to predict or depict the performance of any investment. These views are presented as of the date hereof and are subject to change based on subsequent developments. In addition, this presentation contains certain forward-looking statements which involve risks and uncertainties. Actual results and conditions may differ from the opinions expressed herein. All external data, including the information used to develop the opinions herein, was gathered from sources we consider reliable and believe to be accurate; however, no independent verification has been made and accuracy is not guaranteed.
Neither the Pring Turner Capital Group, nor any person connected with it, accepts any liability arising from the use of this information. Recipients of the information contained herein should exercise due care and caution prior to making any decision or acting or omitting to act on the basis of the information contained herein.

