For the third quarter in a row, stock prices moved into all-time high territory! But it was not all smooth sailing as the market started the quarter with a sharp decline, then recovered and finished near highs. The choppy price action was not a surprise. As suggested in our April newsletter, “After five consecutive months of gains, the stock market is entitled to take a short breather.” Further, we stated we had taken a more defensive stance by locking in some profits and temporarily raising cash balances. These steps helped to soften the impact of the interim price decline and provided extra cash to invest in attractive new opportunities.
What’s next? In our view, the correction that began in April is likely only partially over. We suspect over the next few weeks there will be additional zigzagging as some speculative excesses get wrung out. The good news is that our reliable primary trend stock market gauge, the Pring Turner Advanced Investment Barometer™ (AIB™), is still solidly in a positive position. In simple terms, while the going may continue to be bumpy in the short run, we expect higher stock prices in the second half of the year.

Our AIB™ Is constructed from a variety of momentum, trend following, and inter-asset relationships. The principal function of the barometer is to warn about major bear markets. As the chart depicts, although not perfect, the AIB™ has a credible long-term track record. Since 1966, when this stock market gauge is above 30, the average annual price only returns for the NYSE are +11.3%. When the gauge is below 30, average annual returns drop to -6%. This valuable tool helps us assess the overall risk vs. reward dynamics in the stock market. The goal is to effectively protect your wealth through challenging periods and grow it during favorable times. As long as the AIB™ remains comfortably in “growth” mode, we will maintain our optimistic market outlook.
Why Quality Counts!
Quality has always been an important consideration in stock selection for your Pring Turner investment portfolio. Judging quality in companies can be tricky because it involves analyzing both financial numbers as well as other qualitative traits. Thankfully, Standard and Poor’s (S&P) has been ranking quality for years, providing a simple way to measure it. These stock rankings range from A+ (the best) to D (the not-so-best) and are based on the company’s earnings and dividend data from the last decade. The better the growth and stability of earnings and dividends, the higher the rank.
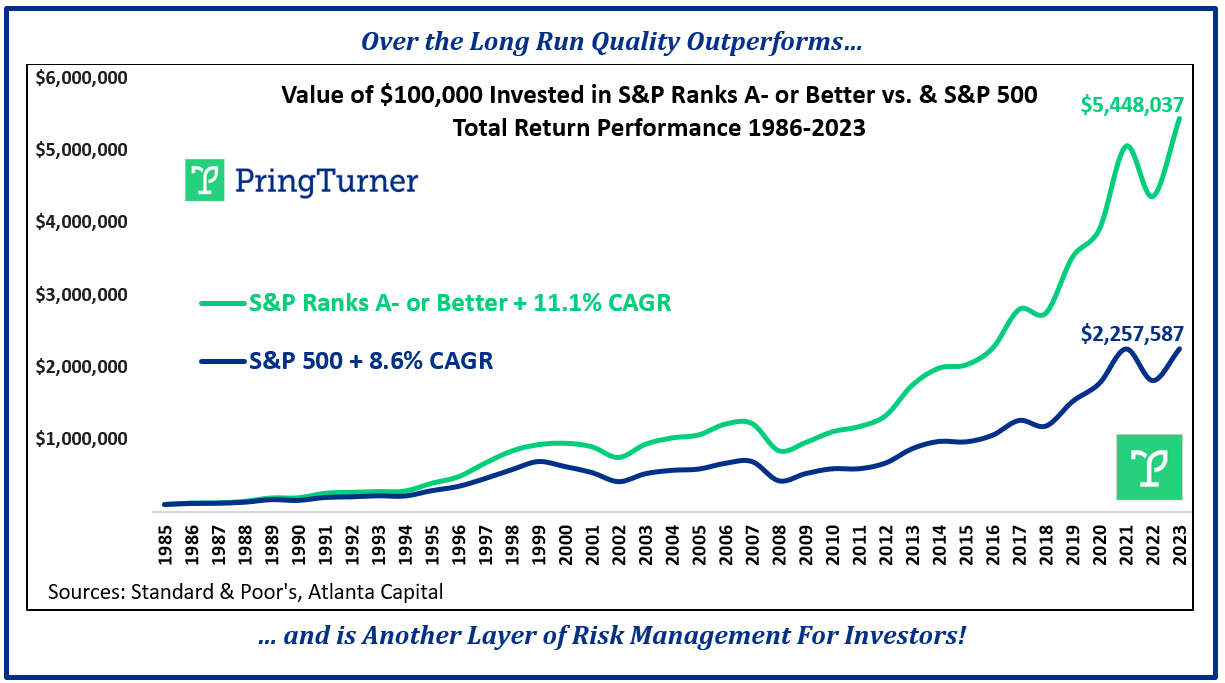
Let’s demonstrate how quality stacks up against the average stock. Between 1986 and 2023, S&P found that the highest quality stocks (those with S&P ranks A- or better) showed off an impressive 11.1% compound annual growth rate (CAGR). In comparison, the S&P 500 index, containing the wide spectrum of both higher and lower quality rankings, posted an 8.6% growth rate.
Put in dollar terms, a $100,000 investment in the S&P 500 on January 1, 1986, with dividends reinvested, would have grown to over $2.2 million by the end of 2023. In contrast, a similar investment in high-quality stocks would have grown to an even more impressive $5.4 million, showcasing a remarkable $3.2 million difference over 38 years. As the graphic illustrates, in the long run, it really pays to invest in higher quality stocks.

Moreover, portfolios focused on high-quality stocks hold up much better during the most challenging market periods. Importantly, when your portfolio takes a gentler decline during a downturn, bouncing back to new heights in the subsequent upturn becomes more manageable. Quality brings added resilience to your portfolio, making the road to full recovery a smoother and speedier journey.
And why do quality stocks hold up so well historically? In recessions, superior businesses may thrive by maintaining profitability when competitors struggle. Their financial strength and steady profits offer flexibility to seize opportunities while weaker competitors strive to stay afloat. Also, during uncertain economic times investors tend to gravitate towards high-quality stocks for their perceived safety. These companies enjoy the added benefit of being owned by long-term-oriented individuals, like you, who are less likely to panic and sell during difficult times. This long-term focus by high quality shareholders reduces selling pressure during sustained market downturns. That truism provides an additional layer of protection for your portfolio.
As the S&P study suggests, highly ranked companies have generally provided higher returns with less risk, fewer negative surprises, higher dividend returns, and act as a cushion to your portfolio during downturns. While we all know there are no guarantees in the investment world, you can sleep better at night knowing that your portfolio is primarily comprised of carefully selected high quality investments. These “cream of the crop” companies provide consistent dividend growth along with long-term appreciation potential.
Summary
So far, things seem to be playing out as expected. Our AIB™ remains strong, suggesting higher stock prices to come. After some additional seesaw action, we fully expect the stock market to make further upside progress in the second half of the year. Pring Turner’s barometers and models, which we have used for decades to carefully manage your investment portfolio, help us sift through the noise and day -to-day confusion that bombards most investors. Our ultimate focus is on the important long-term trends that affect the protection and accumulation of your wealth.
We know the Pring Turner team holds a unique position of responsibility and trust in the lives of you and your families. Protecting and growing your hard-earned assets and standard of living is our foremost priority. Please know we are very thankful to have your trust and confidence.


