The purpose of this article is to make the case for a primary trend rise in yields. If this assumption turns out to be correct, it is within the realm of possibilities that this same rally may also be a turn in the tide for the initial advance in a new, very long-term or secular uptrend. Our quest as investment advisors is to detect significant changes in financial asset trends as early as possible. Early detection of cyclical and secular turning points and aligning portfolios with those new trends makes our mission to protect and grow clients’ valuable assets easier and with less risk. If the primary trend in interest rates has reversed its multi-year decline then bond holders will be subject to massive portfolio losses.
Secular turning points usually develop as markets overshoot and crowd psychology moves to an irrational extreme. At such times, accepted standards no longer apply as markets temporarily move to nonsensical extremes. For example, at the 1990 peak of the Japanese real estate boom, the Emperors’ palace was said to be worth more than the real estate value in California. At the height of the tech boom in 2000, the travel website Priceline.com had a capitalization greater than the combined value of all the major US airlines. It is not inconceivable that global bond markets have reached a similar type of illogical turning point. For example, a recent Wall St Journal article featured a Danish home owner who took out a mortgage. He did not pay any interest, but instead was obligated to receive payments in return for taking out the loan. Five thousand years of interest rate history says it should be the other way around. Welcome to the world of negative interest rates! It is possible that such irrationality can continue, but it is more likely that it will not. Just bear in mind the actuarial challenges for life insurance companies, pension funds and other entities as they struggle to provide for future obligations with returns on fixed income vehicles well below that of their fiduciary requirements.
During the last few decades holding bonds has paid off as substantial capital gains have compensated for declining current return. Now that rates are close to zero, capital gains cannot continue. The only way they could, is for the markets to push yields deep into negative interest rate territory. That would mean pension funds, for instance, would be paying to invest instead of receiving income as a return on capital.
While we think there is a very good possibility rates are in the process of reversing their secular downtrend, more evidence in that direction is needed before coming to a firm conclusion. What can be said, though, is that economic and technical forces justifying a primary trend reversal are rapidly falling into place. Whether that cyclical advance would be sufficient to reverse the post 1981, 35-year downtrend, is a question that will have to be addressed later.
The Economy
The growth path of the economy represents a broad proxy for the demand for credit and can therefore be useful in identifying basic reversals in the trend of interest rates. Some indicators that measure tightness in the system, such as capacity utilization, work well some of the time but have been inconsistent at calling interest rate rallies during the secular bear.
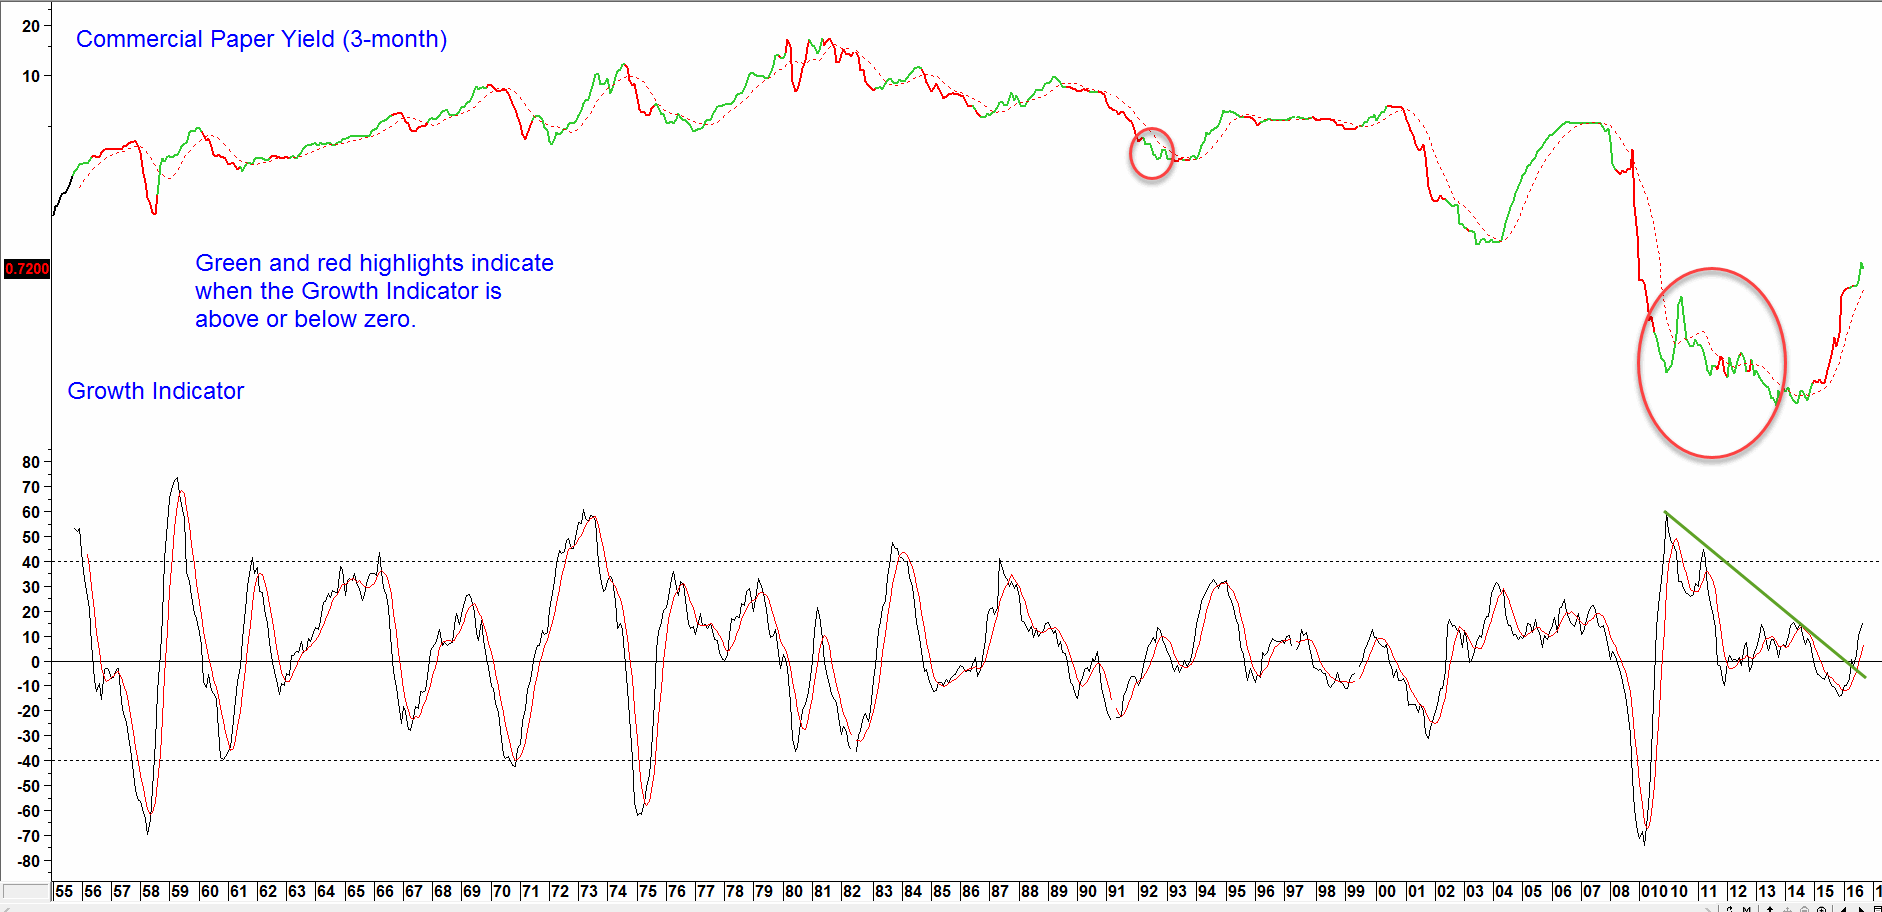
We never expect anything to be perfect, but a composite indicator calculated from a rate-of-change of several economic components has been better than most. We call it the “Growth Indicator” and it is plotted in Chart 1 below.
Chart 1 The Commercial Paper Yield versus the Economy (Source: Martin Pring’s InterMarket Review)
A rising economy generally pushes shot-rates higher.
Green highlights indicate when it is above zero; i.e., reflecting an expanding economy, and red when below. Federal Reserve policy has been particularly accommodative in the last few years, which could explain why our model gave a false signal of strength in the 2009-2011 period. Whenever a fundamental indicator is used, it makes sense to combine it with a trend following technique. In that way we can see whether the price series being monitored is responding to any fundamental changes. Our weapon of choice in this regard is the 12-month MA. On that basis the recent positive zero crossover by the Growth Indicator has certainly been confirmed by the yield action, whereas, say the false positives in the 2002-03 and 2009-2011 were not. So this economic ‘Growth Indicator” is showing investors should expect rising interest rates and therefore lower bond prices to go along with a rising economy.
The Yield Curve and Commodity Prices
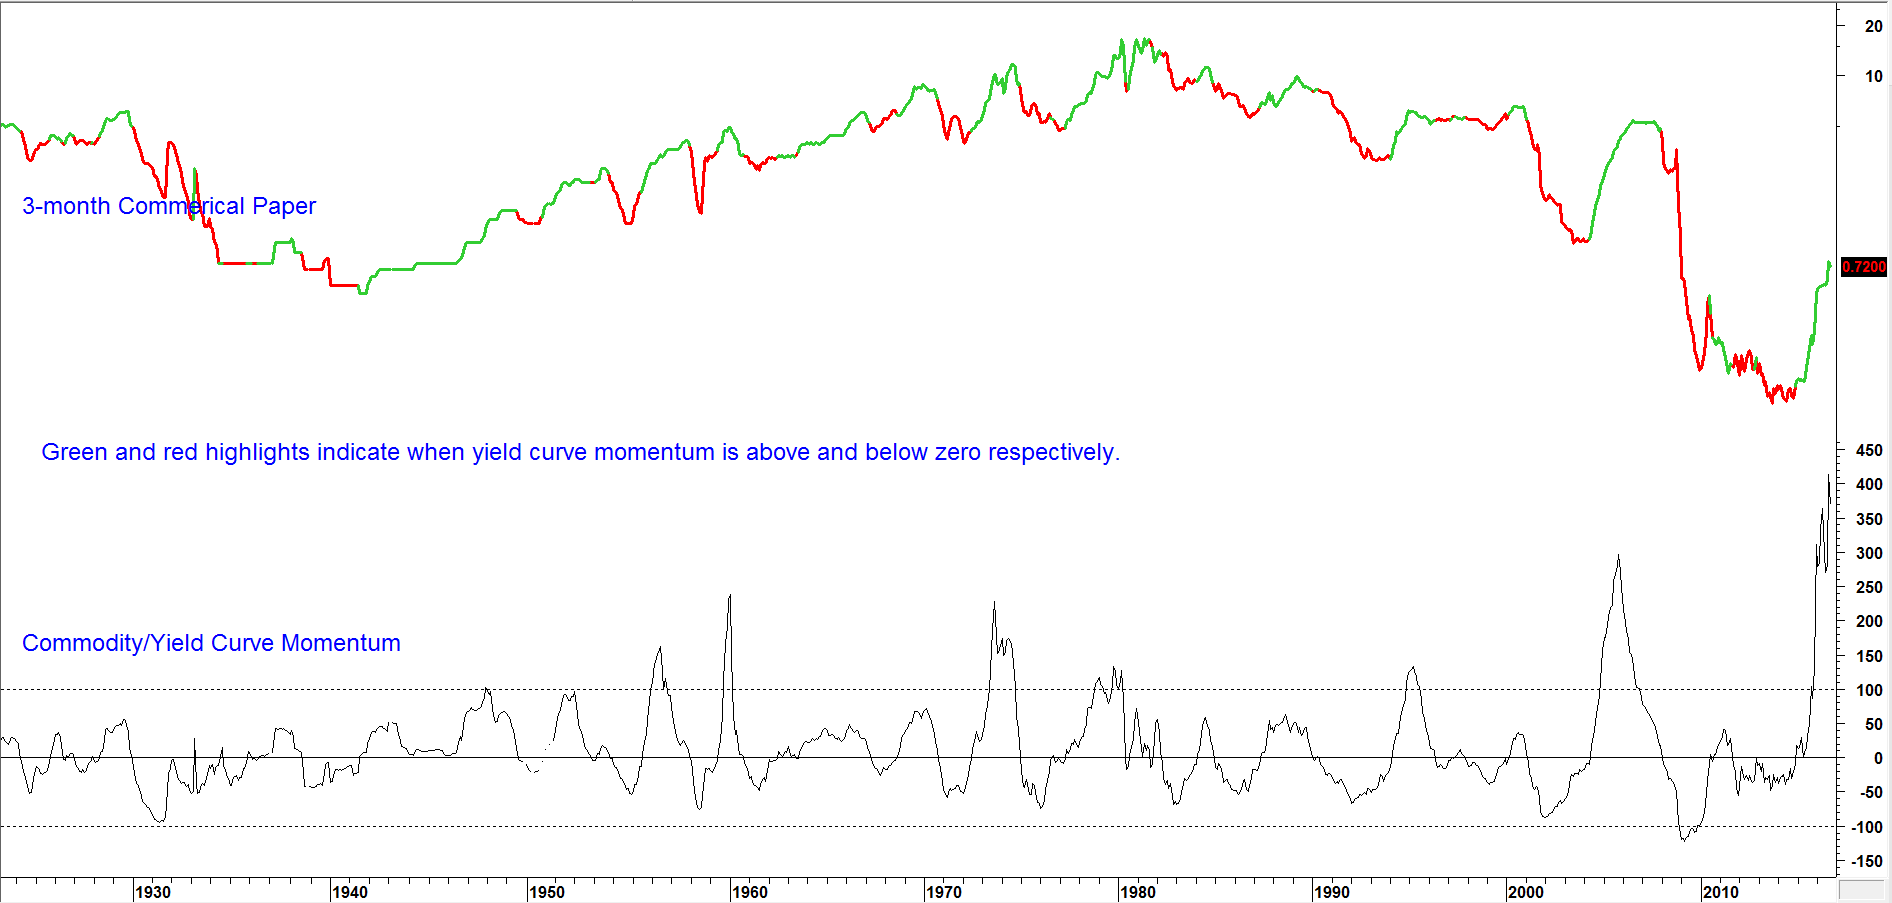
Another indicator that has proved useful in gauging the ups and downs of money market rates has been our Commodity/Yield Curve Momentum, featured in the bottom window of Chart 2. Yield curves compare the performance of a short-term maturity to a longer-term one. Our favorite is the relationship between the yield on 3-month commercial paper and Moody’s corporate AAA yield; the so-called corporate yield curve. The direction of the curve tells us whether financial conditions are tightening or easing. A rising one, where short-rates are gaining on long rates, generally reflects a tightening in conditions and an improving economy. When short-rates exceed longer-term ones it tells us that environment is sufficiently stringent that a slowdown or actual contraction in the level of business activity should be expected.
Interest rates are also significantly impacted by rising or falling commodity prices. The bottom window of Chart 2 features an indicator that is constructed from a rate-of-change of both elements. The green highlights show when this composite momentum series crosses above zero a bullish environment for short-term interest rates exists, and vice versa. Currently, the indicator is at a record high reading. That tells us two things. First, it is likely to be some time before a signal of lower rates is triggered by a negative zero crossover. Second, experience tells us that whenever any momentum indicator moves to a record high, it is usually a sign of a multi-decade reversal. Put more bluntly, this is one of the characteristics we would expect to see at a secular turning point for rates.
Chart 2– Commercial Paper Yield and a Momentum Indicator (Source: Martin Pring’s InterMarket Review)
When yield curve and commodity momentum rises, so do yields.
If this is indeed a secular turning point for rates bond investors will have to reverse their thinking by unwinding strategies that have done well during the post 1981 secular downtrend in yields. This will come as a shock, since most all investors today have only known a secular bear market in yields (bull market in bonds).
Credit Spreads and Their Effect on Bond Yields
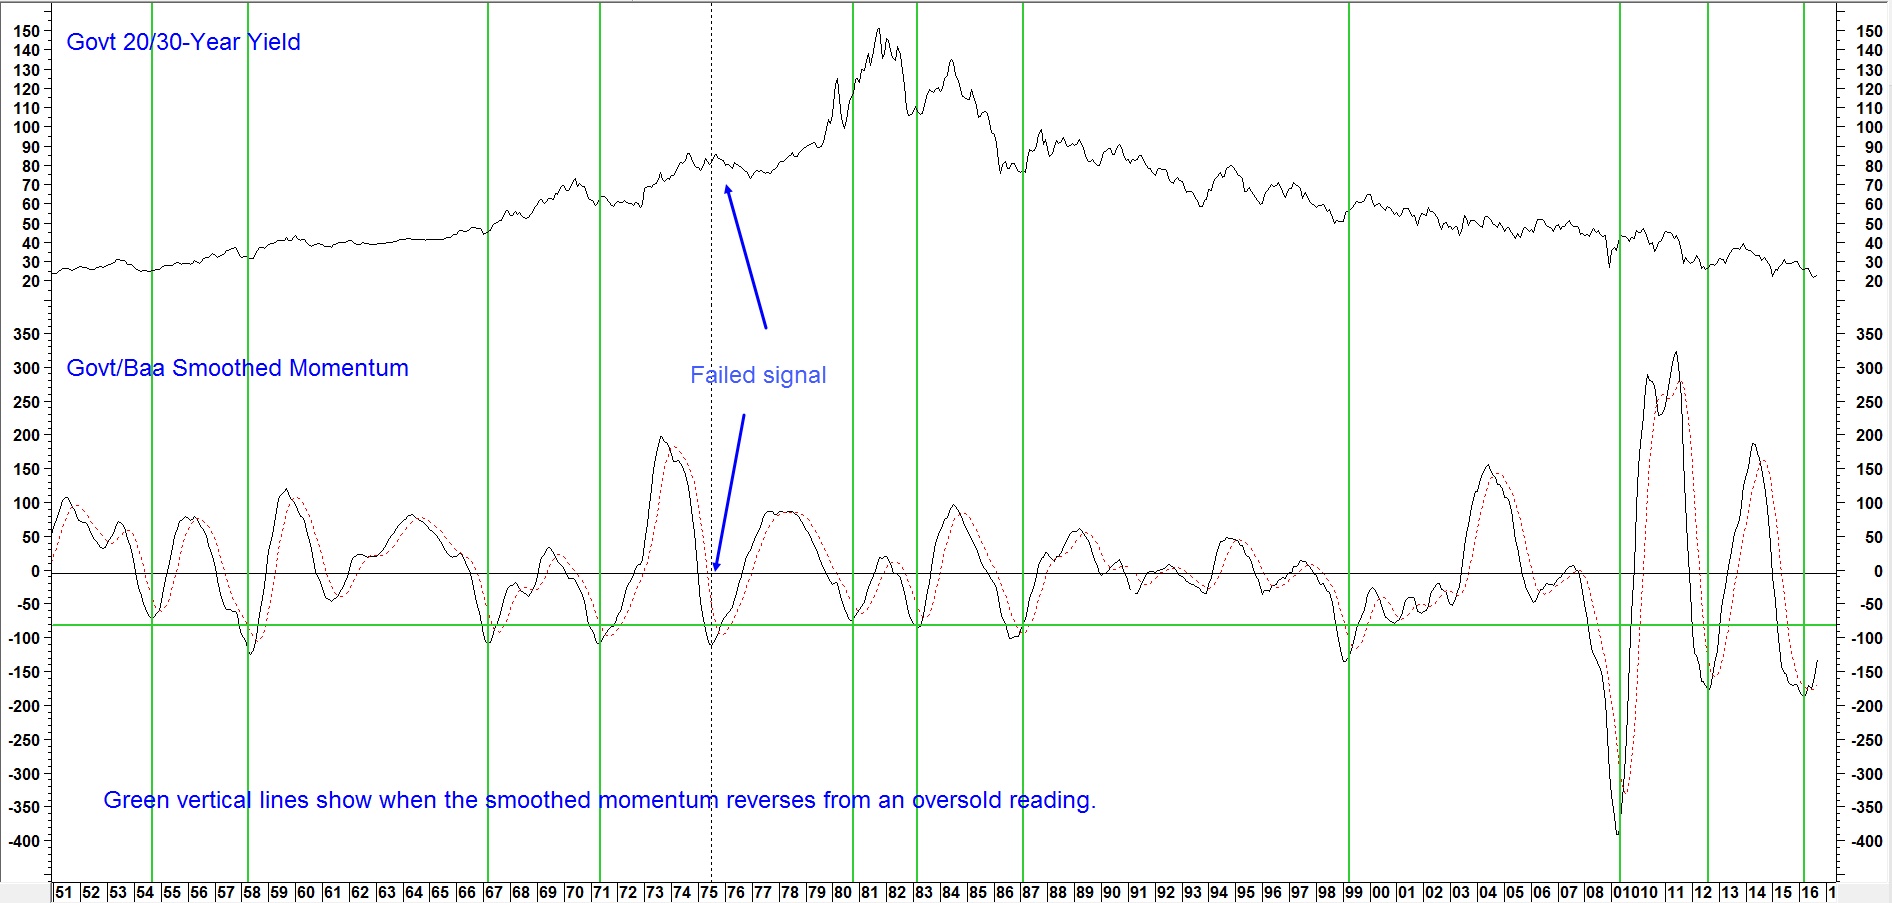
Changes in confidence among bond market participants reflect their expectations for the economy. This sentiment is best expressed through credit spreads, where a high quality credit market instrument is compared to a more questionable one. An example is featured in the center panel of Chart 3 at the top of the following page. This series represents a long-term smoothed momentum of the actual ratio between the 20-year government and Moody’s Baa corporate bond yield. When the indicator is rising, it indicates that lower quality bonds are out-performing their higher quality counterparts in terms of price. In other words, bond market investors as a group are down playing the risk of credit defaults, because of their upbeat view of the economy. Increased credit demands place upward pressure on rates when business activity picks up. Not surprisingly, when this momentum series bottoms from at or below, the overstretched green horizontal line in the lower window of the chart, the 20-year yield has a strong tendency to rise. Examples of such reversals since the 1950’s are shown by the vertical lines.
Chart 3-Government Bond Yields versus a Credit Spread Momentum (Source: Martin Pring’s InterMarket Review)
Upside reversals in credit spread momentum are usually followed by higher rates.
The Technical Picture
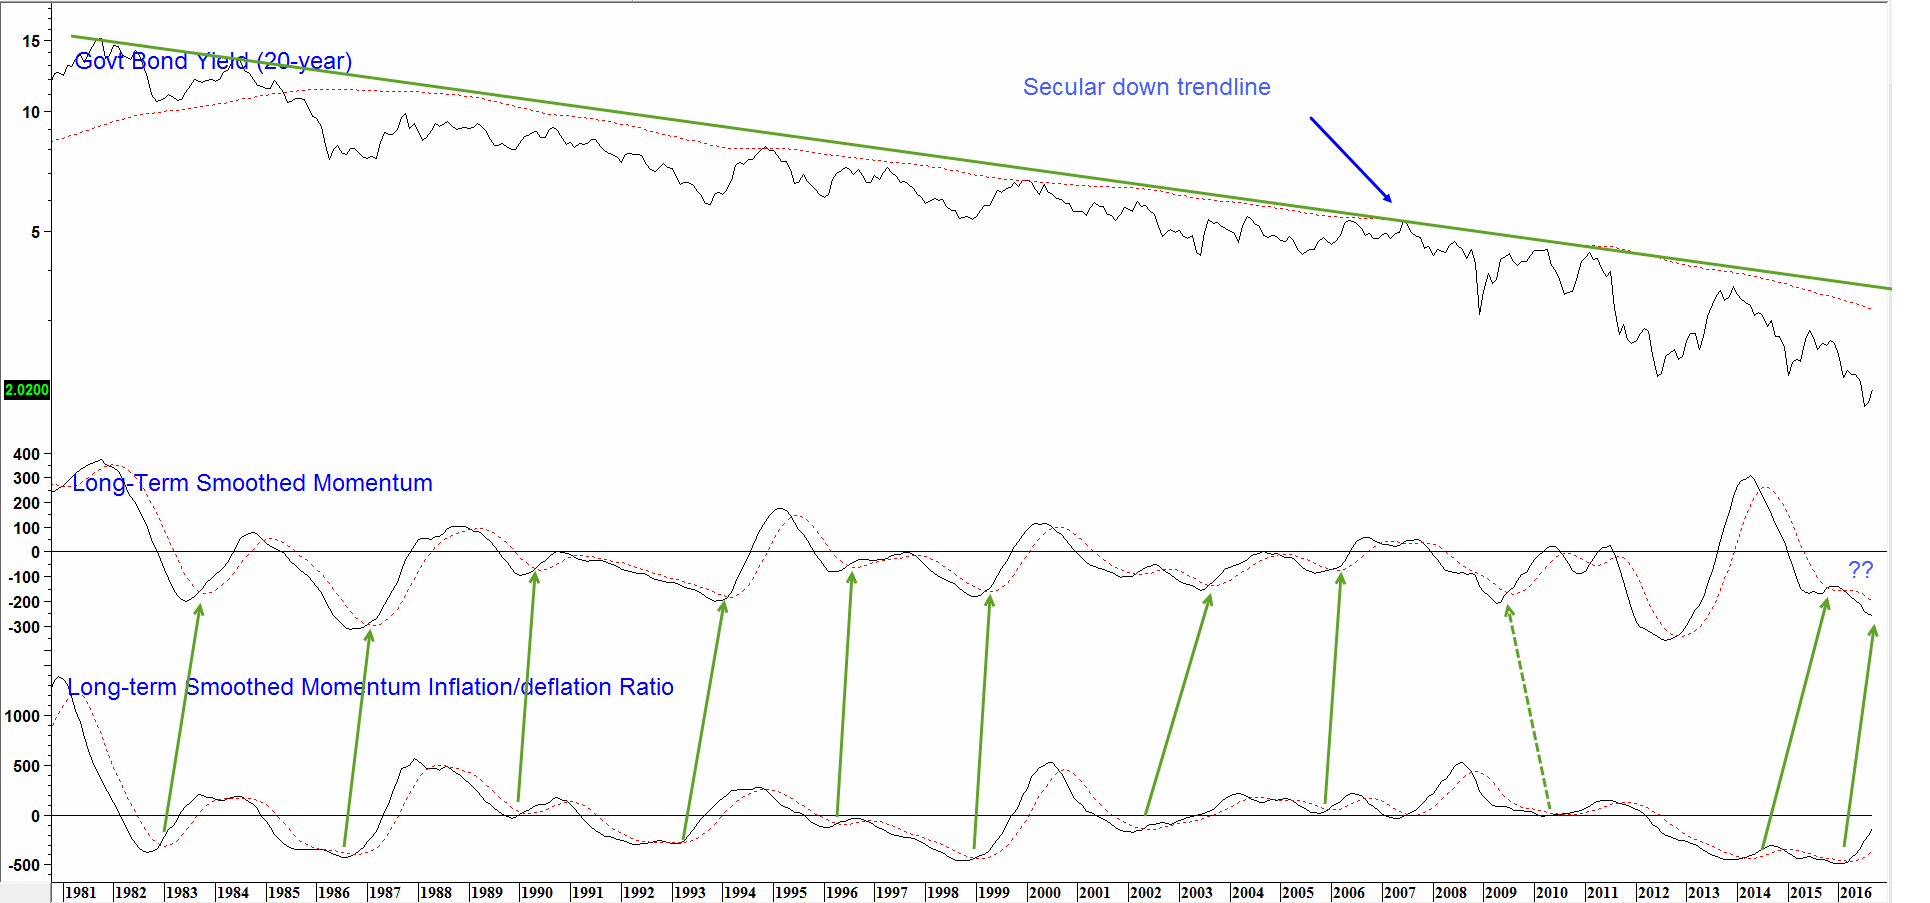
The monthly average of the 20-year bond yield may have touched a new secular low in July, but the indicators are hinting at a reversal. The long-term smoothed momentum for the yield itself, featured in the center panel, is still declining. However, a similar measure calculated from the ratio between our Inflation and Deflation sensitive equity indexes, in the bottom window, has already begun to turn up. Inflation sensitive S&P industry groups would include such areas as mining and energy, whereas deflation sensitive groups would embrace defensive and interest sensitive areas such as insurance companies, utilities, etc. The ups and downs of this relationship therefore represent the stock market’s way of voting for inflation (rising rates) or deflation (falling rates). In this respect, the green arrows demonstrate that reversals in this indicator have consistently represented an advance warning of a bottoming of both the 20-year yield itself and its momentum.
Chart 4- Government Bond Yields versus Two Momentum Indicators (Source: Martin Pring’s InterMarket Review)
Momentum for sector relationships in the equity market usually lead the bond market.
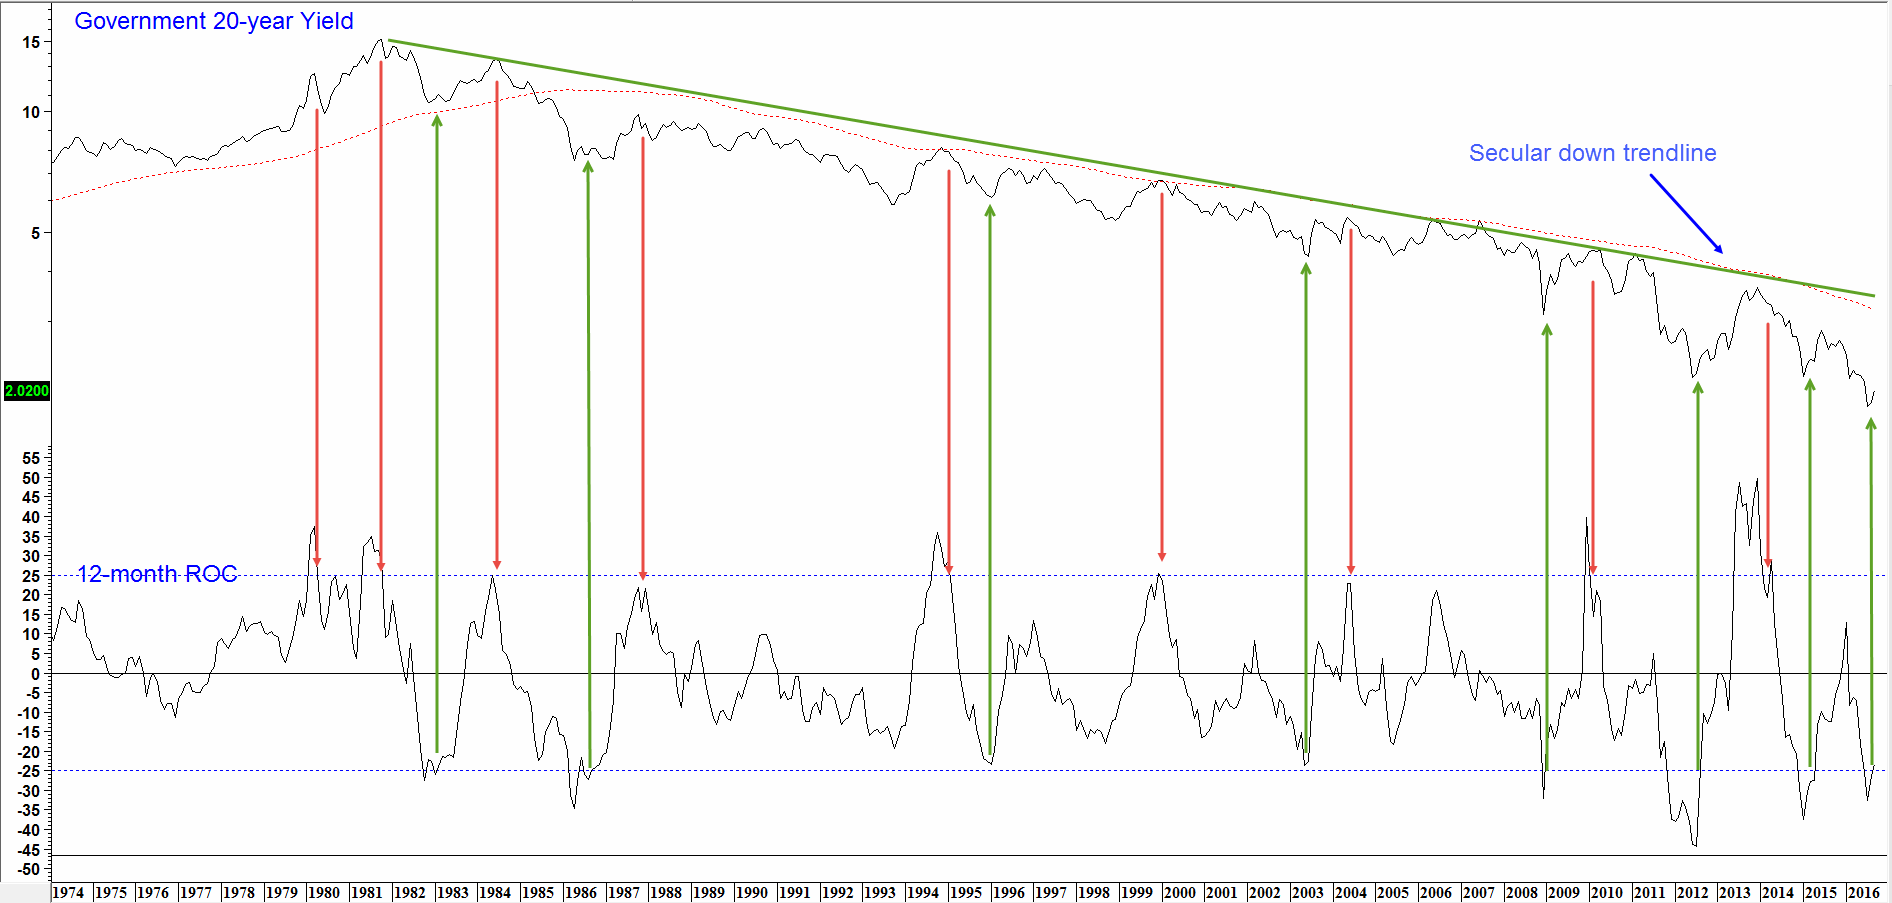
More evidence of a potential near-term reversal comes from the 12-month ROC for the 20-year yield. The arrows flag the 17 instances since 1955 when the ROC has reversed from a position close to or in excess of the -25% or +25% overstretched lines. The indicator, using an incomplete October average, has just crossed above its oversold zone again. Certainly we cannot call it a decisive reversal at this point. However, this rate of change is very over extended on the downside, which means that it will need increasingly higher doses of lower rates in order to maintain that downward trajectory.
Chart 5 – Government Bond Yields and a 12-month Rate-of-Change (Source: Martin Pring’s InterMarket Review)
Reversals through the + and- 25% zone consistently signal primary trend changes in interest rates.
Conclusion
Based on several cyclical indicators that have been pretty consistent in the last 50-years or so, it is difficult not to conclude that rates are headed higher. Whether that reversal will be of sufficient magnitude to also reverse the 1981-20?? secular bear market in yields and bull market in bonds is open to question.
We recommend bond investors remain on high alert. Higher primary trend interest rates mean lower bond prices and losses for unsuspecting investors. We have begun taking steps to manage the increasing risk of owning bonds in portfolios. The first step required a lowering the overall allocation, starting with reduced exposure to the longest dated maturities, as these are subject to the largest risk. Step number two involved the building of a “ladder” of short to intermediate term bonds. A ladder arranges bond investments with successive maturity dates to allow the flexibility to reinvest into higher paying bonds as each rung of the ladder comes due. Even during a secular up move in yields, there will still be cyclical opportunities to temporarily invest in longer dated bonds. Our view going forward, is that it will more profitable to “rent” longer term bonds than to “own” them to maturity. In a world with conventional wisdom turned upside down with both negative yields and 95% of global bonds yielding less than 2%, active strategies to protect and grow wealth will be required. After 35 years of near continuous declining yields and a desperate reach for income today, bond investors are unprepared and vulnerable to any rise in interest rates. Paying attention and acting on trend changes will help you profitably navigate the cyclical and secular shifts in yields and bond prices. Stay tuned.
In the meantime, if you live in Europe, you really ought to take advantage of those mortgages paying the borrower, as 5000 years of history tells us that deal won’t be around much longer!
Martin Pring
Investment Strategist, Pring Turner Capital Group
DISCLOSURES:
Pring Turner Capital Group (“Investment Advisor”) is an investment advisor based in Walnut Creek, CA. The Investment Advisor invests on behalf of individuals, organizations, and other financial advisors that appreciate a conservative and active investment style that aims to deliver consistent results without taking undue risk. The key objective of the Advisor’s investment philosophy is to not lose big during major market declines, making it easier to compound wealth over the long run.
The Investment Advisor is registered with the U.S. Securities and Exchange Commission. The views expressed herein represent the opinions of Investment Advisor, are provided for informational purposes only and are not intended as investment advice or to predict or depict the performance of any investment. These views are presented as of the date hereof and are subject to change based on subsequent developments.
In addition, this document contains certain forward-looking statements which involve risks and uncertainties. Actual results and conditions may differ from the opinions expressed herein. All external data, including the information used to develop the opinions herein, was gathered from sources we consider reliable and believe to be accurate; however, no independent verification has been made and accuracy is not guaranteed. Neither Investment Advisor, nor any person connected with it, accepts any liability arising from the use of this information. Recipients of the information contained herein should exercise due care and caution prior to making any decision or acting or omitting to act on the basis of the information contained herein. ©2016 Pring Turner Capital Group Walnut Creek, CA. All rights reserved.

