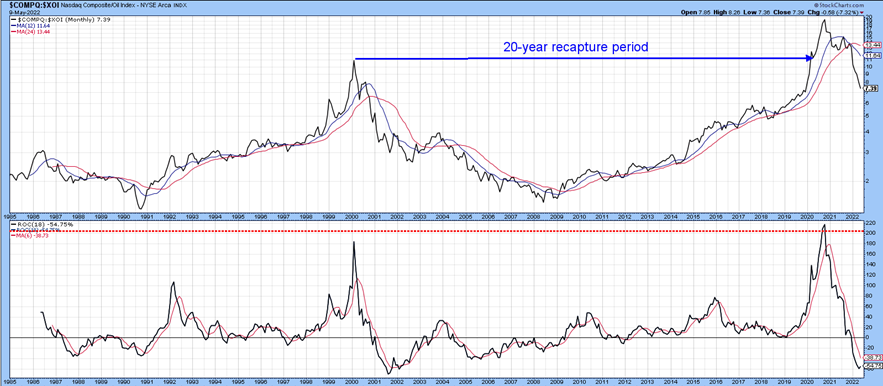
The conclusion did not specifically target the technology sector per se, but more its performance relative to energy, a relationship that had swung to a multi-decade extreme. At the time I observed: “that long-term leadership is in the process of reverting away from technology and moving in the direction of energy and other resources.” In this instance we used the tech dominated NASDAQ as a proxy due to its longer historical record, and the S&P Integrated Oil Index as that for energy and resources. Both industries faced potential regulation. In technologies case, greater government interference was expected to act as a headwind for profits, whereas increased energy regulation would hamper supply and enhance profits through higher prices. Chart 1 shows that the ratio has fallen sharply in the intervening year to the extent that some sort of oversold bounce is likely as part of an overall multi-year decline favoring energy.
Chart 1 -NASDAQ/Energy Ratio and an 18-month ROC 1995-2022
The 12-year uptrend in this relationship has reversed to favor energy over technology.
Source: stockcharts.com
Before we take a closer look, a few observations on bubbles are in order.
What is A Bubble?
A bubble develops when the price of an asset has been rising for many years. It culminates in an almost exponential rise that abruptly reverses, as prices move to levels that cannot be sustained by the underlying fundamentals. An easy money policy helps the bubble inflate, a tighter one normally causes its demise.
Measuring Bubble Type Conditions
There are of course, many aspects that characterize bubbles and manias, several of which you can read about here. Sentiment plays a huge part, but apart from gut feel, which is not statistically accurate, it is extremely difficult to pin-point the beginning of the unravelling process. That is because there are no long-term indicators that can be consistently applied across multiple markets. Furthermore, when sentiment data is available, it takes the form of short-term polling, rather than information gathered with the purpose of assessing a long-term perspective. A key problem is distinguishing a perfectly normal experience, such as a stock or commodity doubling over a five-year period and something that is far more insidious. A good example would be when the S&P grew by a factor of 2.5 in the 10 years separating its 1974 low and 1984 high. Prices seemed a bit heady at the time, but it was no bubble.
Introducing the 18-month ROC
A useful approach to the study of bubbles is to include a momentum indicator in the analysis. Momentum in the form of a rate of change is helpful because it closely tracks market sentiment. A useful span that tracks the final exponential rise and exhaustion characterizing the turning point of a bubble is 18 months. The rationale lies in the fact that the 18-month period embraces almost half of the 41-month business cycle, originally discovered by Joseph Kitchen in the 1920s. Recessions have been less prevalent since the 1960s. However, when growth slowdowns are counted along with actual contractions, it can be shown that this cycle has been operating consistently since the early 1960s.
The approximate bubble bursting tipping point for the 18-month ROC occurs when it surpasses a reading of 200% and then reverses. Such elevated levels are very unusual, because it takes an immense amount of bullish sentiment to double the price of any market in such a relatively short time span. When, following several years of rising prices, investors bid prices up to that degree, it usually means things are getting way ahead of the fundamentals.
Two Types of Momentum Peak
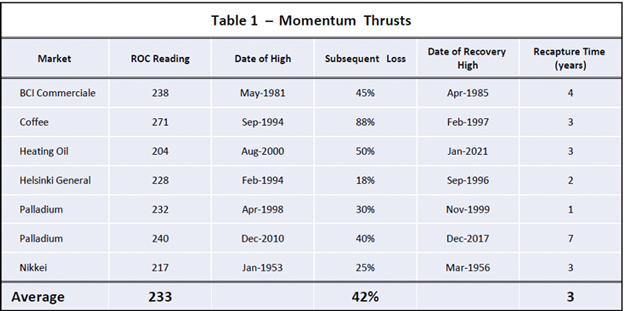
We should also note that there are two kinds of 200% readings. The first possibility arises when the ROC reaches 200% coming off a major low or following a multi-year trading range. That’s not a bubble because this type of action is super positive longer-term as it signifies a young and vibrant bull market.
Examples of markets reaching an 18-month ROC following a major low or multi-year trading range
Source: Martin Pring’s Intermarket Review
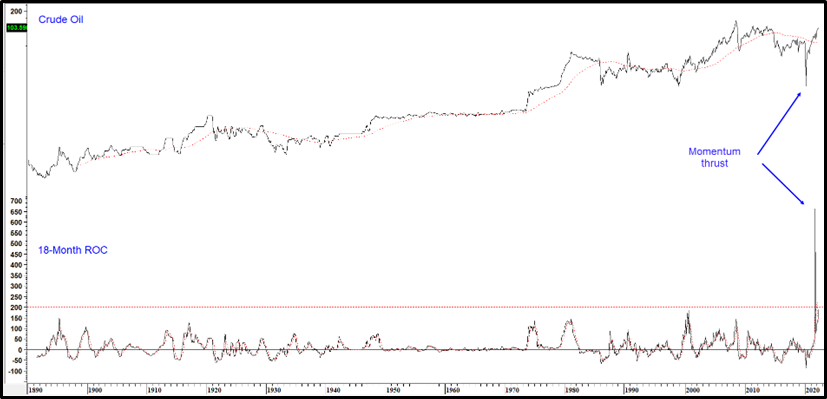
Table 1 shows these momentum thrusts are typically followed by corrective activity ranging between an 18-88% decline. Chart 2 shows that the crude oil price may be in the process of currently experiencing a momentum thrust off the 2020 low.
Chart 2 Crude Oil and an 18-month ROC 1890-2022
Crude oil shows an excellent example of a momentum thrust.
Source: Martin Pring’s Intermarket Review
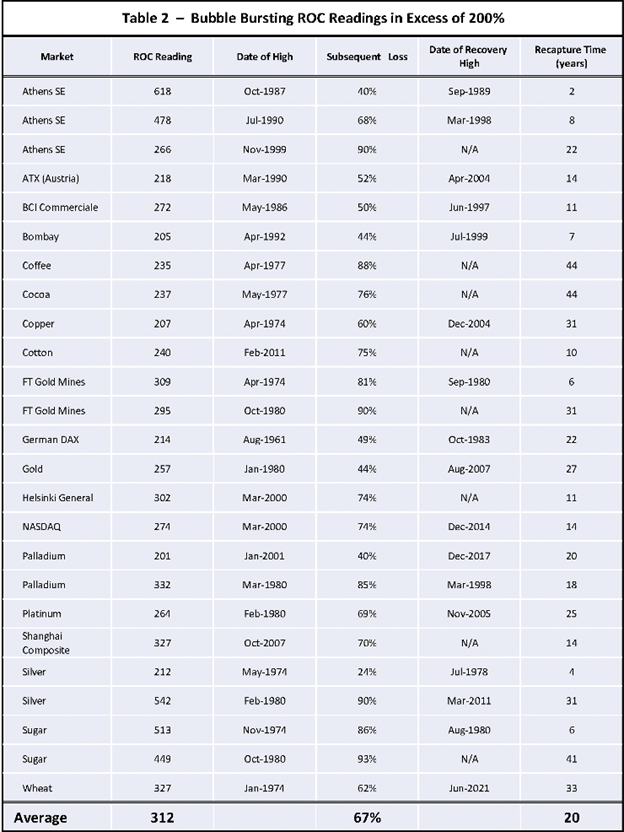
The second follows many years of rising prices and reflects a final climax or total exhaustion of buyers. This is a true bubble and is bearish when it finally reverses. Based on our database covering international equity markets and commodities, Table 2 shows all the 18-month ROC readings in excess of 200% that were preceded by a multi-year advance. The unusual nature of a 200%+ reading can be appreciated from the fact that the highest 18-month observation ever seen for the S&P and its predecessors was 124% in 1844. Indeed, the ROC for the S&P itself barely rose above 100% at the 1929 top! That point also demonstrates that a major market peak does not have to be accompanied by a 200%+ reading, but that a 200%+ reversal is invariably followed by some form of important decline.
Identifying the Turn
Using the benefit of hindsight, it is really easy to spot the 200%+ peaks in the ROC, but how is this achieved in real time? Fortunately, bubble bursting is mostly an abrupt process that unravels quickly as careless and leveraged positions are hastily liquidated. That means that once a 200%+ reversal is underway, it is often a pretty straight-line affair on the downside. A negative crossover of a 6-month MA of the ROC is not infallible but often proves to be a timely objective indication that the tide has reversed. That said, neither the 200% or 6-month MA crossover rules can be profitably and consistently applied to individual stocks as there is too much volatility and therefore numerous false signals to make this approach practical. Chart 1 shows this approach in action, as the ROC for the Tech/Energy ratio has not only dropped below its MA but has now reached negative territory.
Referring back to Table 2 of bubble bursting examples, the Subsequent Loss column shows that the average loss following the bubble peak was a pretty nasty 67% drop. It is also worth noting that about a third of the examples were followed by a drop of 80% or more.
The final column in the table shows that the average time taken to surpass the high registered at the bubble peak was 20 years. That surprising number arises because it takes a lot of time to work off the excessive bullish psychology associated with the ROC peak. Those labeled “N/A” in the Date of Recovery High column are labeled as such because the high referred to has never been permanently surpassed.
The Bursting of the Bitcoin Bubble
Some may disagree about the “bubble” label for Bitcoin, However, it seems to us that a financial category coming out of nowhere 10-years or so ago, reaching a $3 trillion capitalization at its November 2021 peak (13% of US GDP), is an extraordinary and probably unprecedented feat. Looked at another way, the price stood at $164 in 2015 and touched $68,000 last November.
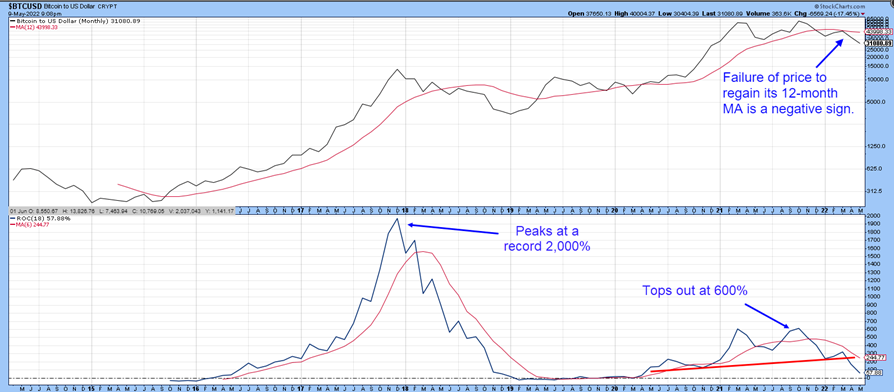
Genuine bubbles take many years to form as they need to be preceded by a multi-year advance, extending at least four years. That means that the 2017 peak, being preceded by only 2-3-years of publicly recorded data is not long enough to establish a bubble path. Hence, we are interpreting the 2017 ROC peak as a momentum thrust. Clocking in at a record 2,000% percent, that was some thrust! Subsequent action certainly meets the characteristics of a Table 1 candidate. First, following a 200%+ reversal, the price experienced a relatively shallow and brief correction. Second, it achieved a new high within a 2-3-year period, underscoring solid upside momentum at the time.
Chart 3 also supports the idea of a bubble, as Bitcoin’s 18-month ROC moved to a scary 600% last October. Now the indicator is below its 6-month MA and has violated its up trendline, strongly suggesting that the peak for momentum is in.
Chart 3 Bitcoin and an 18-month ROC 2015-2022
A momentum peak and trend break signal the likely bursting of the Bitcoin bubble.
Source: Stockcharts.com
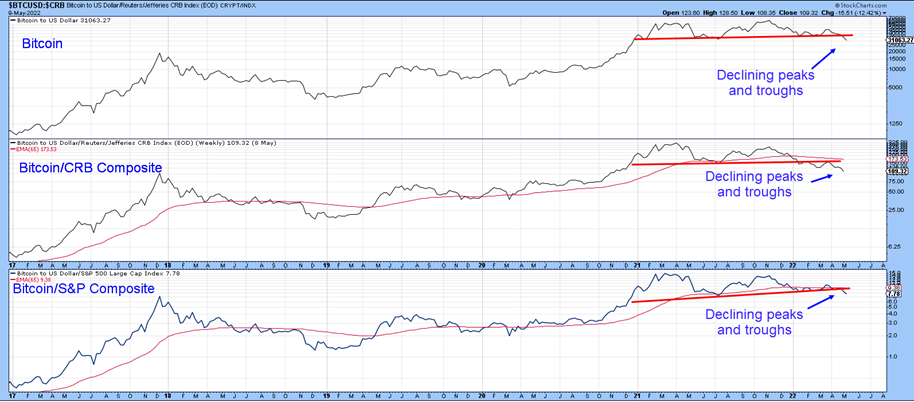
We see that Bitcoin itself has completed and broken down from a distribution formation and started to experience a series of declining peaks and troughs in Chart 4. Relative action against both stocks and commodities has also broken down from a top, suggesting that Bitcoin has lost a lot of its cross-asset appeal and is even weaker than its absolute price action might suggest.
Chart 4 Bitcoin vs Stocks and Commodities 2017-2022
Bitcoin’s relative price action is another indication of a major price top.
Source: Stockcharts.com
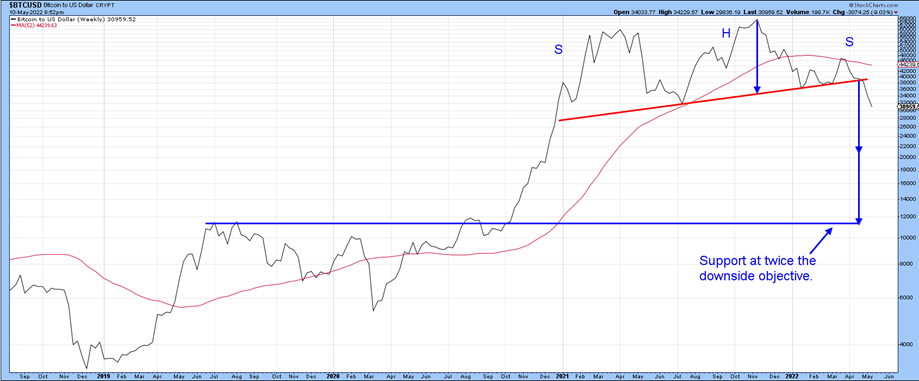
Finally, Chart 5 shows the top in greater detail, along with the minimum indicated downside objective. Because prices often move by multiples of the objective, The second arrow shows that a double objective would take it down to the area of support at the previous highs. To be clear, that $12,000 objective is not a prediction, but meant more as a statement of possibilities.
Chart 5 Bitcoin 2018-2022
The chart shows the completion of a major top and its indicated possible objective..
Source: Stockcharts.com
The price has already sunk from a $68,000 high to a recent $30,000. That’s an awfully large drop. However, in the history of punctured bubbles it’s not that much. The price will undoubtedly continue to zig and zag, but with easy money no longer available watch out below. Remember, as the tide goes out there are likely to be a substantial number of Warren Buffett’s naked and fraudulent swimmers yet to be exposed. That’s what history teaches when bubbles inevitably deflate.
Thanks for reading.


