An examination of the prevailing state of the secular trend for inflation- adjusted stock prices reveal some interesting similarities between 1968 and 2024, and these parallels extend beyond the realm of financial markets. It’s important in this exercise to use inflation-adjusted stock prices because inflation can seriously erode the purchasing value of a portfolio over time, and this will not be picked up by simply using nominal prices.
Secular Trends
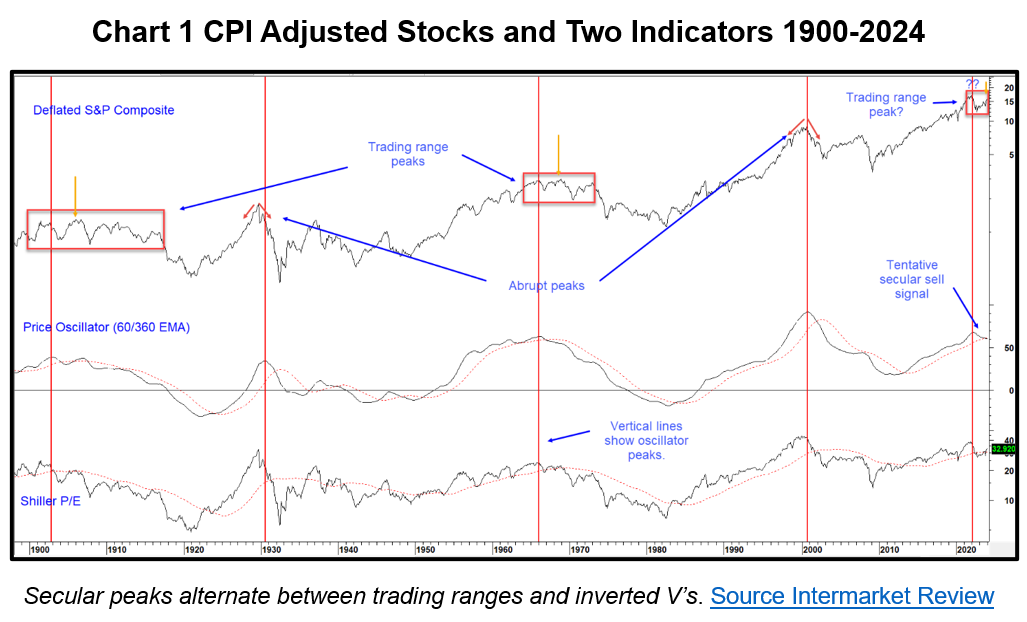
The term “secular trend” refers to the long-term swings in CPI adjusted equities that have averaged 15 to 20 years. Equities thrive on modest inflation or deflation, as this provides a relatively stable foundation on which secular bull markets can evolve and prosper. Eventually, crowd psychology reaches an extreme and reverses, as perceptions of excessive inflation or deflation take hold. As a testament, the three secular bear markets for stocks since 1900 have averaged losses of 65% in real terms. Psychology is reflected in Chart 1 by the Shiller P/E ratio. This well-known valuation tool is normally thought of as a fundamental indicator, but we regard it as a measure of sentiment. Otherwise, how can you explain that investors were happy to pay $32 for a dollar’s worth of earnings in 1929, were they not optimistic. Yet willing to pay less than $7 in 1932, if not downright pessimistic?
The Similarities Between the 1966 Secular Peak and 2022
Chart 1 shows an oscillator that reflects these secular trends. The vertical lines intersect with its peaks, which are not that far from the inflation-adjusted S&P and Shiller P/E highs. Based on its current elevation and trajectory, there’s a reasonable chance the secular bull market emanating in 2009 began to reverse in December 2021.

There have been four secular tops since 1900 that were characterized either by a multi-year trading range, or an abrupt inverted “V” type reversal. It’s also worth noting that they alternated. For example, the rangebound version developed in 1901 followed by an abrupt turn in 1929. This pattern was repeated at the 1966 and 2000 peaks. If it extends, the current secular bull should end with a third trading range type of top. Four data points, taken on their own, are insufficient evidence to base a forecast. However, it’s worth noting that the two previous rangebound tops developed under an inflationary environment, compared to the abrupt 1929 and 2000 peaks, which were accompanied by more of a deflationary one.
Finally, if December 2021 marks the secular peak, the 2022 primary bear market has a lot more in common with initial drops in its 1901 and 1966 rangebound equivalents than the first down leg following the 1929 or 2000 peaks. The 2022 decline took ten months and lost 25% in nominal terms. That’s certainly more in character with the 12-month 30% decline in 1901 and the 9-month 17% drop in1966. Using nominal month end prices, the drop following the 1929 peak was 80%, over a 3-year period. The decline between 2000 and 2002 lasted 26 months and lost 46%.
Note that the orange arrows in Chart 1 identify the secondary peaks in the 1901 and 1966 secular bears and that each was higher in real terms than the orthodox tops. In other words, it’s quite likely the December 2021 high will be exceeded in both real and nominal terms, but still be part of an overall topping out process.
The Business Cycle Background 1966-1968 versus 2022-2024
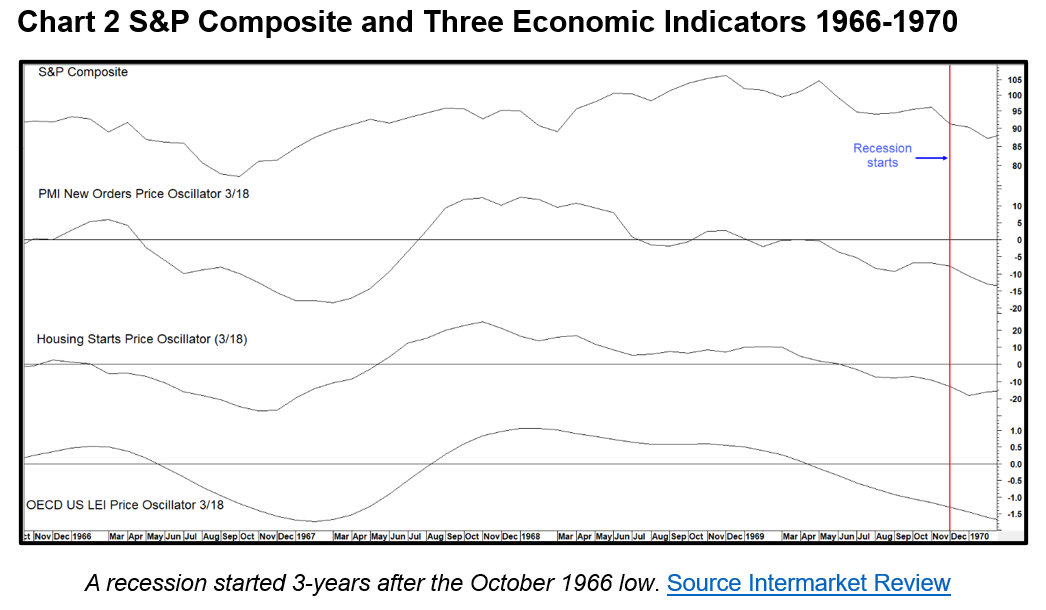
Chart 2 shows the drop following the1966 peak was associated with a weakening economy. Many indicators fell to what is normally regarded as recession territory. However, The National Bureau of Economic Research (NBER), the official arbitrators of such things, didn’t identify one. The data also deteriorated in 2022, to the extent that some sectors, such as manufacturing, did drop into recession territory but no official call in this direction has been made there either.

The idea of a near miss recession is also portrayed in Chart 3. It features a derivative of our Pring Turner LEI, which calls a business contraction when it drops below its red horizontal Recession Caller line. It gave its only false negative in over 65 years of history in 1966, but didn’t decisively violate the line in 2022.

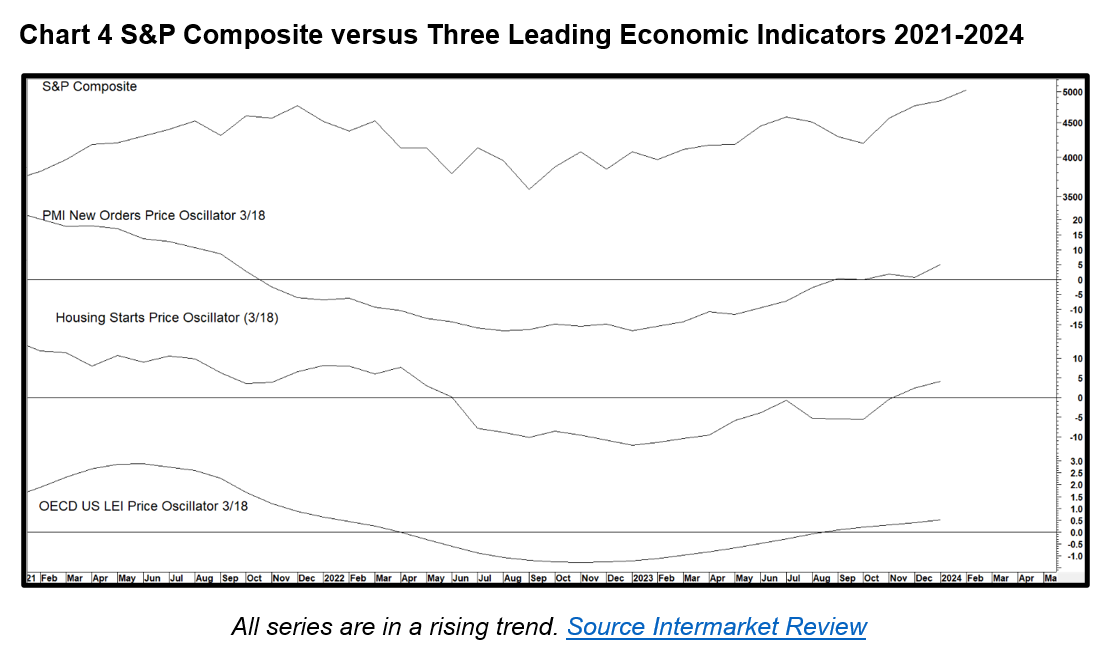
Chart 2, featuring the earlier period, shows the three economic indicators started to turn up in early 1967. Chart 4 shows they reversed higher in early 2023. In the previous period, a recession followed just under 3 years later in December 1969. That gave the market plenty of time to rally up for two years, subsequently spending another year discounting the 1970 recession.

If the past is prologue, which it rarely is, that would translate to a stock market peak in the fourth quarter of this year, with a recession starting in late 2025, when most will likely have given up on the idea.
At this time, all three indicators continue to rally, and the Recession Caller in Chart 3 has moved above zero, which supports the idea that equities are headed higher in a continued cyclical bull market. One major difference between now and then is that the Fed eased up in 1966 and short-term rates dropped by 20%. If the recovery extends, as expected, a drop in yields will become progressively more unlikely.
Stock Market Comparison
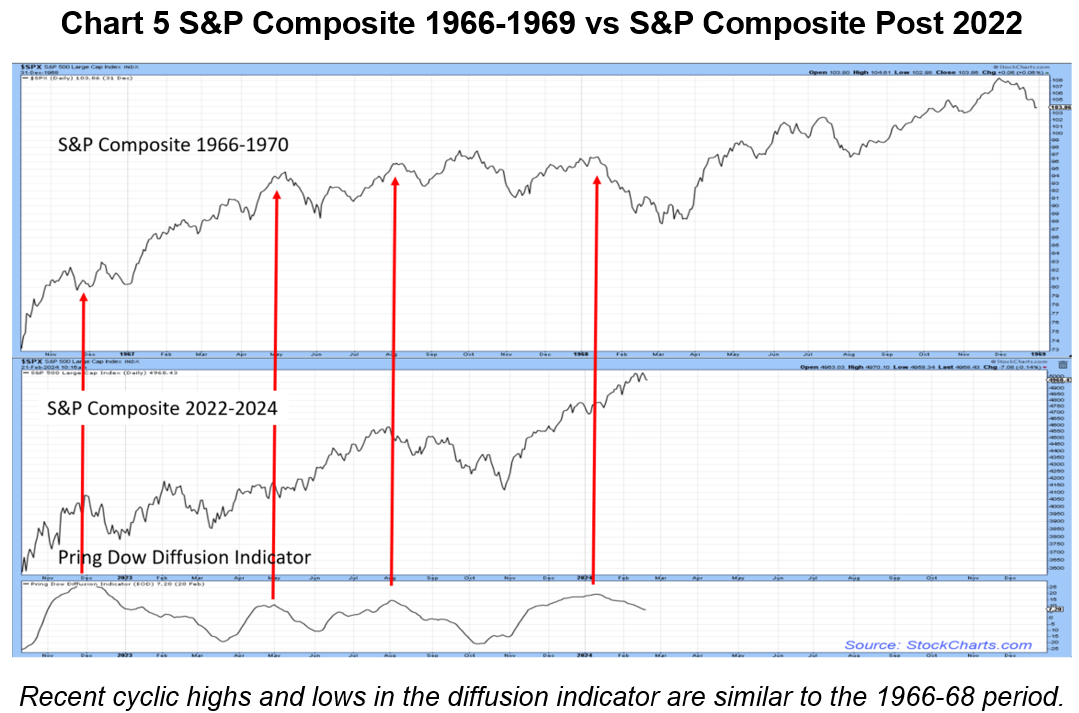
Chart 5 compares the nominal S&P Composite in periods following both the October 1966 and 2022 lows. Minor rallies and reactions are different, but the overall trajectories are similar. The indicator in the bottom window, the Pring Dow Diffusion indicator, monitors the percentage of Dow components in a positive intermediate trend. Data for the 1960s is not available, so a comparison is not possible. However, peaks in this indicator offer a close fit with the S&P, reminding us that in the last few weeks many stocks have been correcting under the cover of a rising Index. The indicator is still overstretched, suggesting corrective action is likely to extend into March. This would be consistent with the average for presidential election years, which bottom around the same time. The good news is that the 1968 trajectory calls for higher ultimate prices, as does the current position of many primary trend indicators.

Déjà vu:1968 versus 2024
We advise not taking the comparison too far down the rabbit hole, as the AI platform Gemini (formerly known as Bard) cautions, “Comparing 1968 and 2024 reveals both intriguing parallels and crucial differences. Remember, context is key, and simply drawing parallels without considering the unique circumstances of each period can be misleading.” In other words, these two years may have a lot in common, but let’s not get too carried away with the comparison.
Nineteen sixty-eight was two years out from the 1966 secular peak. If December 2021 turns out to be another secular high-water mark, 2024 would be similarly positioned. However, the economic and stock market characteristics between these two periods extend further. In 1968 the January Tet offensive exacerbated anti-Vietnam war sentiment, which split the democratic party and affected the course of the war. In 2024, the October 7, 2023 Hamas attack stirred up anti-war sentiment, again splitting the party, and the war itself will almost certainly have long-term geopolitical consequences.
Both are Presidential election years with incumbent democrats (Johnson and Biden). Johnson resigned on March 31, 1968, following an unexpectedly strong anti-war challenge in the New Hampshire primary from Eugene McCarthy. The current incumbent of the White House is under increasing pressure to follow suit due to cognitive issues.
It’s too late for a serious primary challenge, so any move for change would have to take place at the convention which, like 1968 is being held, yes you guessed, Chicago! Two more things to ponder. Both years had a man called RFK on the ballot and Johnson was ultimately followed by the legally challenged Richard Nixon. Sound familiar?
Bottom Line:
Our study comparing 1968 and 2024 is important to investors for two big reasons. Number one, if a new secular bear market for equities is forming, a more proactive risk management approach will be required. In other words, a passive, buy and hold strategy will likely prove frustrating. Second, inflation is a stealth tax on wealth. A decade or more of higher inflation will significantly erode investment returns in real terms. The solution is taking advantage of cyclical opportunities, like now, to build wealth safely. Just as important, investors need a carefully thought-out game plan to protect wealth during the inevitable cyclical declines.
Learn how our unique approach and personalized advice can help you grow the value of your financial portfolio.


