For years I have always thought of the gold price as a discounting mechanism for inflation. In recent months though, the price has rallied sharply under what appears to be a very deflationary background. It could be that gold is looking through all of this and predicting an inflationary outcome. Nevertheless, I keep asking myself the question of whether it is possible for the price of the yellow metal to prosper in the event that the huge global debt overhang starts to unravel. Bottom line, is it possible for gold to experience a bull market regardless of whether the environment is inflationary or deflationary? To put it another way, can we get to a heads I win, tails I win situation? To answer, let us start off by considering gold’s relationship to inflation and subsequently dealing with the deflationary aspects.
Chart 1 – Gold vs. Commodity Prices Long-term Smoothed Momentum (Source: Reuters)
")
Gold price momentum tends to lead commodity price momentum upwards and downwards. (click to enlarge)
Gold Leads Commodity Prices
History shows that the principal driving force behind sustainable price trends in the yellow metal comes from anticipated changes in the balance between inflationary and deflationary forces as they revolve around the business cycle. Almost invariably, gold is bought and sold as an inflation hedge, pure and simple. There are circumstances though, when gold prices rally in a deflationary environment, but we will get to that later.
First, it is important to understand that gold leads commodity prices. Chart 1, above, for instance, compares the long-term smoothed momentum between gold and the CRB Raw Industrial Index, a composite of several industrial commodities which serves as a proxy for inflation. The arrows show that turning points in the price of the yellow metal consistently lead and occasionally coincide with that of the CRB; i.e., gold discounts inflation. The ellipses show periods that do not comfortably fit this hypothesis, and the dashed arrows the out of sequence events. They are, by far the exception. Based on this experience, the current rising momentum curve (for gold), is forecasting higher gold and commodity prices.
Chart 2 – Gold vs. Its Long-term Smoothed Momentum (Source: Reuters)
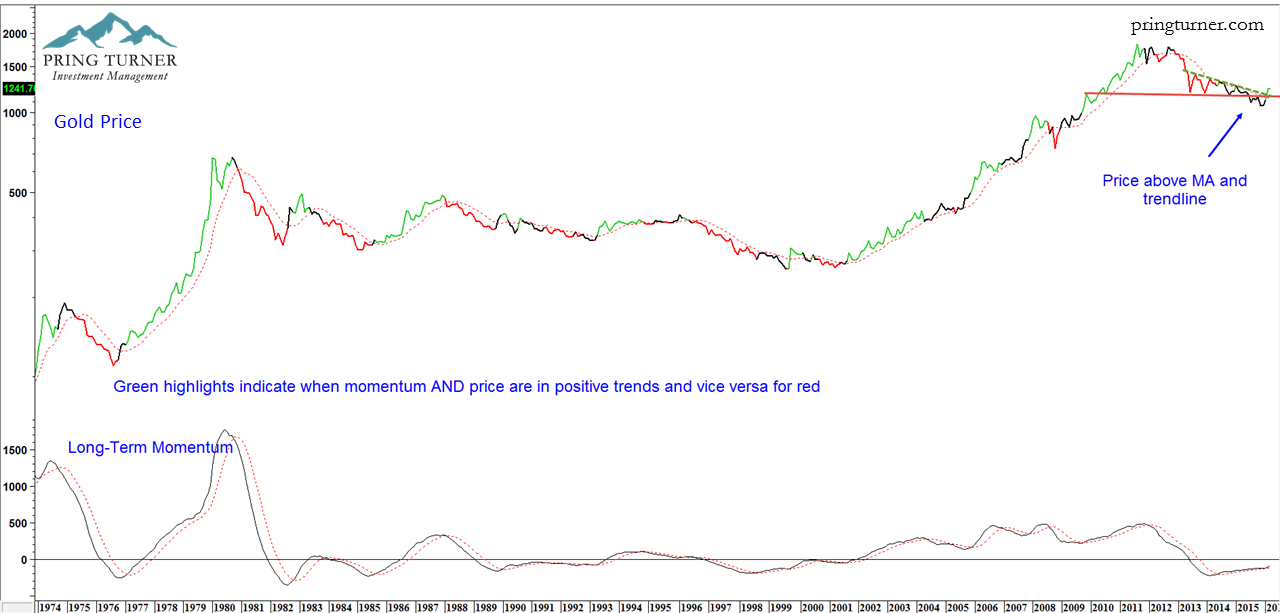
Gold tends to experience substantial moves when price and long-term momentum are aligned. (click to enlarge)
Gold Generally Discounts Commodity Prices
The fact that both the gold price and share prices for gold mining companies are comfortably above their 12-month MA’s reinforces the primary bull market case for bullion. In this respect, our gold model (Chart 2 above ) goes bullish when the long-term smoothed momentum crosses above its MA and this is confirmed with a positive 12-month MA crossover by the price itself. Such periods are represented with a green highlight and reverse conditions with red. Black highlights reflect neutral conditions. This model turned bullish in February.
Chart 3 – Industrial Commodity Prices vs. Capacity Utilization (Source: CRBtrader.com and Federal Reserve)
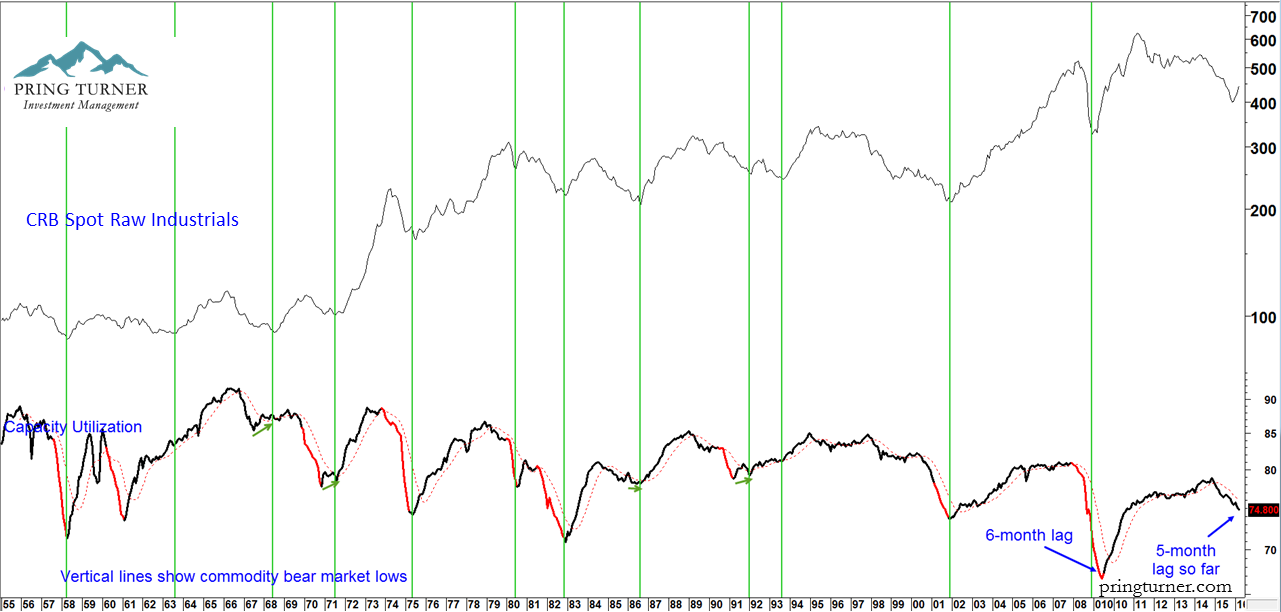
Capacity utilization (bottom) continues to fall and has not yet triggered a buy signal for industrial commodities (top). (click to enlarge)
The bullish gold trend and gold’s discounting mechanism may be positive for commodities, but some economic indicators that have consistently identified commodity bear market lows continue to decline. The vertical lines in Chart 3, for instance, flag cyclical lows in the CRB Spot Raw Industrials since the 1950’s. They either lag (see the small green arrows) or coincide with capacity utilization. Only in 2009 did this economic series lag the bear market bottom in commodity prices, and that was by 6 months. It has been 5 months since last October’s low. The utilization numbers continue to decline and are not yet supporting the bullish commodity case. They could, of course, reverse to the upside at any moment. But what if they do not and the manufacturing sector continues to deteriorate? Surely that would be bad for the gold price given its inflationary discounting mechanism.
Gold as an Inflation Hedge and the Influence of Real Interest Rates
Chart 4 shows the gold price deflated by the CPI. Despite the 2000-2011 run up, “real” gold remains below its peak set in 1980, hardly an inflation hedge. However, 1980 represented a secular extreme. Averaging out the data by running a (green) linear regression line through it shows that the March 31 deflated price is just a bit above the line. This indicates that using average prices, gold has been a satisfactory inflation hedge, but not when purchased substantially above trend.
Chart 4 – Inflation Adjusted Gold vs. Real Interest Rates and Recessions (Source: Reuters and Federal Reserve)
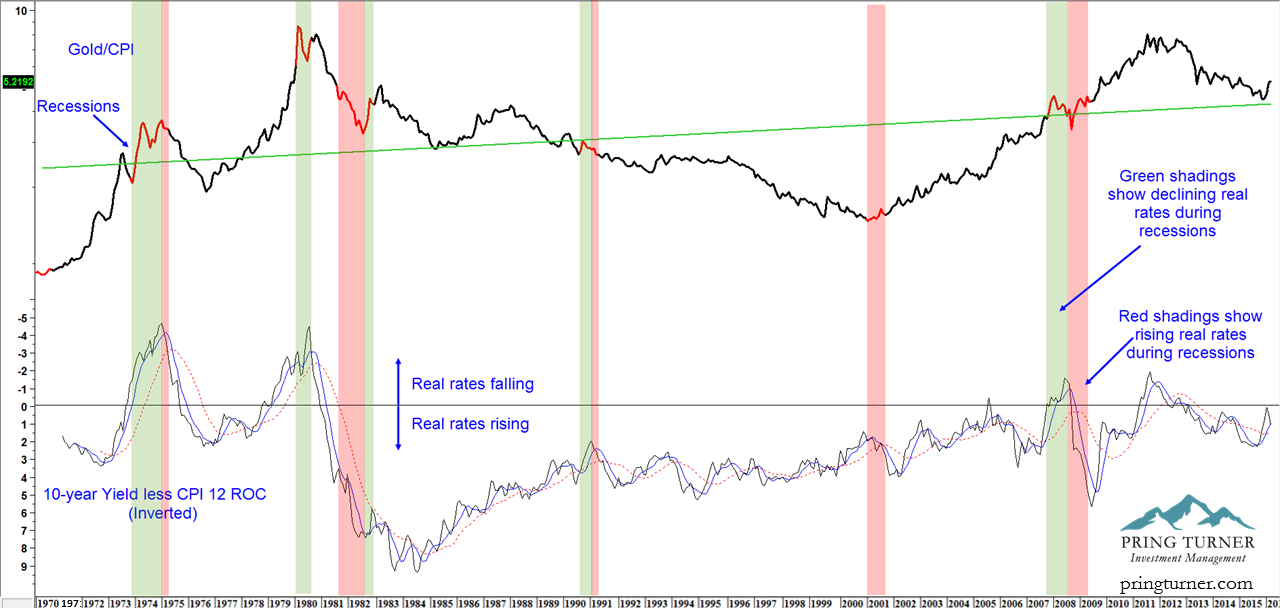
Inflation adjusted gold prices usually start the recession in a rising mode. (click to enlarge)
The red highlights in Chart 4 represent recessions, or pockets of deflation. In four of the six contractions since 1970, inflation adjusted prices ended the recession at a higher price than it entered. Only the 1982 experience was associated with much in the way of a loss. The black line in the lower panel of Chart 4 explains why this is so. It represents a measure of real interest rates by calculating the difference between the 10-year yield and the 12-month ROC of the CPI. The blue and red lines represent a 6- and an 18-month smoothing, respectively. All three series have been plotted inversely to correspond with movements in the gold price.
Many observers use the level of real interest rates in determining bullish or bearish environments for the gold price. After all, the four spikes in the inversely plotted series in Chart 4 were each associated with major gold price peaks. However, a more useful technique seems to come from an analysis of their trend. About half the time during (inversely plotted) recessions, real rates initially rally along with the gold price, then fall just prior to the recovery. This is reflected in the green/red shading combinations. The only exception to the “trend” rule developed at the secular low in 2001 when our inversely plotted rate series was falling, yet the deflated gold price rallied. In the 1981-1982 period, they reversed their roles.
Chart 5 – Real Gold and Real Rate Model (Source: Reuters Federal Reserve)
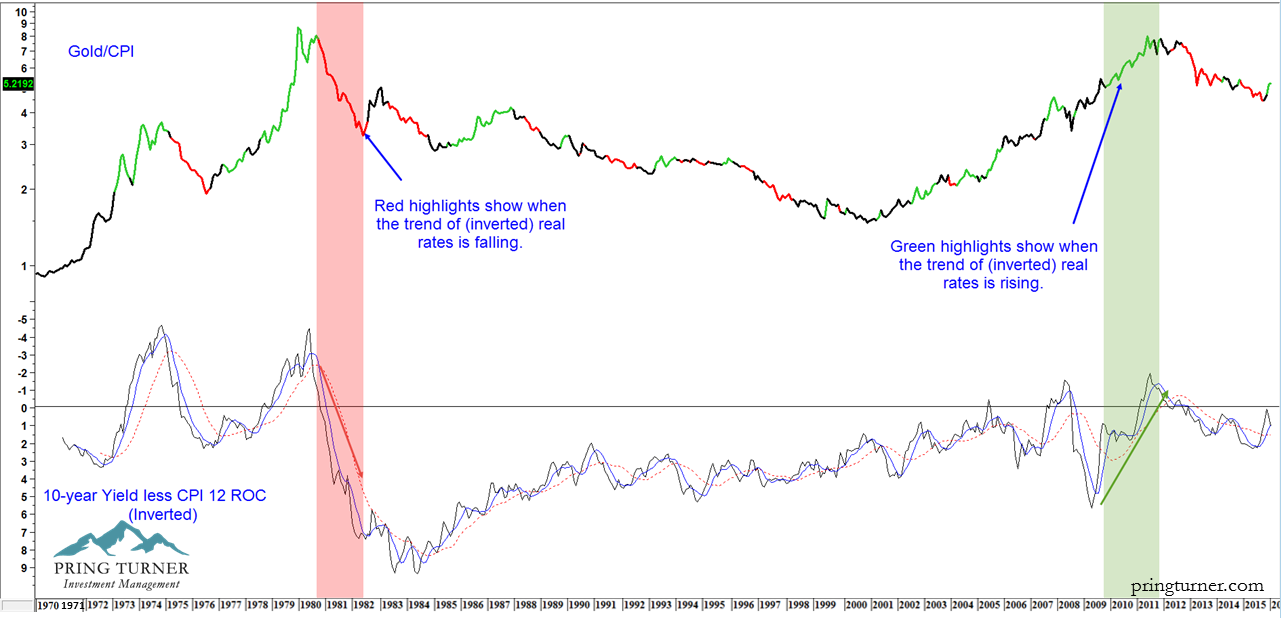
A trend of falling real rates are usually positive for inflation adjusted gold prices. (click to enlarge)
A Real Interest Rate Trend Model for Gold Prices
Chart 5 takes our real interest rate approach a step further in the form of a model. This technique goes bullish for gold and earns a green highlight when two conditions are met. First, it is necessary for the trend of real rates to be declining. This happens when the inversely plotted 6-month MA is above its 18-month counterpart and vice versa. Second, the model requires a confirmation from the price, which should be trading above its 9-month MA (see the green shading 2010-2011). Opposite conditions trigger a red highlight (see the red shading 1981-1982).
Table 1 below indicates that bullish results using inflation adjusted gold since the early 1970’s have returned a monthly average annualized gain of 14.9%, whereas the corresponding loss from bearish signals has averaged -13%. Bullish results for nominal gold were more impressive of course, with a gain of 21%. The average bullish holding period was 7.5-months and the largest drawdown was -16%.

Source: Pring Turner Capital Group, Reuters
*Past performance is not necessarily indicative of future results. Average Annual Return figures calculated with monthly data, from Reuters. Monthly return figures were computed for each signal by averaging monthly price returns and then annualizing the average monthly return to reach the “Average” Annual Return figure.
If the World Slips Into a Deflationary Spiral, Can Gold Still Rally?
The relationship between inflation adjusted gold, real interest rates and recessions raises the question of whether the price would rally in the event that the economy weakens to the point where the Fed would be tempted to push rates into negative territory. Using the lessons from our earlier discussion, the answer is yes, but only as long as the trend of real rates is declining.
There is also a logical explanation, which arises from the fact that negative rates penalize savers for holding bank deposits. The degree of penalization would depend on how low rates would go and how prevalent negative rates are in the system. For example, in Japan negative rates are currently limited to money parked in the BOJ and have not yet directly affected consumers. If they were to spread to the rest of the financial economy, the alternative to parking money in the banking system would be holding currency. However, that comes with its own problems, such as physical storage, being able to use large amounts of physical paper to make transactions, security concerns and so forth. On the other hand, gold could be an acceptable alternative. That is because the carrying cost, net of storage, would be positive because the price of the yellow metal would go into a state of backwardation. Positive rates represent a cost, whereas negative ones would reward investors for actually holding it.
The big problem for gold would be its sensitivity to price fluctuations, and obvious capital risk. Investors though might be encouraged to diversify their portfolios by holding relatively small quantities of the yellow stuff. Since the amount of gold in existence is finite compared to other asset classes, it would not take much in the form of a small allocation spread amongst a large number of portfolios to push the price substantially higher, provided the trend of real rates continued to move lower.
Thus, in either extreme case it becomes a heads you win as gold discounts an inflationary outcome, or tails you win, if the global debt overhang unwinds under a trend of declining real interest rates.
The question then is if this bullish outcome plays out, what is the ideal investment vehicle for this new cyclical bull market? After all, there are many ways to participate. Investors may choose amongst them bullion, individual gold stocks, gold related ETF’s, coins or even precious metals futures. The manner in which we have chosen to invest in gold demonstrates our philosophy of building several layers of risk protection into our client portfolios. Instead of investing in gold directly, we prefer to invest in gold royalty companies or “Streamers.” Stay tuned for “Gold Opportunities, Part II”, where we will elaborate on the numerous advantages our clients enjoy by investing in the “streamer” business.
Martin Pring
Investment Strategist, Pring Turner Capital Group
DISCLOSURES:
Pring Turner Capital Group (“Advisor”) invests on behalf of individuals, organizations, and other financial advisors that appreciate a conservative and active investment style that aims to deliver consistent results without taking undue risk. The key objective of the Advisor’s investment philosophy is to not lose big during major market declines, making it easier to compound wealth over the long run.
The Advisor is an investment adviser registered with the U.S. Securities and Exchange Commission. The views expressed herein represent the opinions of Advisor, are provided for informational purposes only and are not intended as investment advice or to predict or depict the performance of any investment. These views are presented as of the date hereof and are subject to change based on subsequent developments.
In addition, this document contains certain forward-looking statements which involve risks and uncertainties. Actual results and conditions may differ from the opinions expressed herein. All external data, including the information used to develop the opinions herein, was gathered from sources we consider reliable and believe to be accurate; however, no independent verification has been made and accuracy is not guaranteed. Neither Advisor, nor any person connected with it, accepts any liability arising from the use of this information. Recipients of the information contained herein should exercise due care and caution prior to making any decision or acting or omitting to act on the basis of the information contained herein. ©2016 Pring Turner Capital Group. All rights reserved.